PR(Precision Recall) curve VS ROC curve에 대한 근본적인 이해를 돕는 글들이 있다.
| predicted negative | predicted positive |
|-----------------|---------------------|---------------------|
| actual negative | True Negative (TN) | False Positive (FP) |
| actual positive | False Negative (FN) | True Positive (TP) |
[1]과 [2]에서 설명하는 내용은 비슷하다. ROC 커브는 Recall(=Sensitivity)과 False Positive Rate(= 1-Specificity)인데, 이 둘은 모두 actual class가 1인 것중에서 1로 분류한 비율과 0인 것 중에서 1로 분류한 것의 비율을 보는 것인데, PR 커브는 Precision과 Recall(=Sensitivity)을 사용하는데, Recall은 같은데 Precision은 1로 분류된 것 중에서 실제 1의 비율을 보는 것이다. Precision은 실제클래스가 1인 샘플들의 base probability 또는 prior probability가 달라짐에 따라서 Precision이 달라진다. 반면, Recall(=Sensitivity)과 FPR은 base probability 또는 prior probability가 항상 같다. [3]에 PR, ROC를 잘 설명한 그림이 있어 복사해왔다.
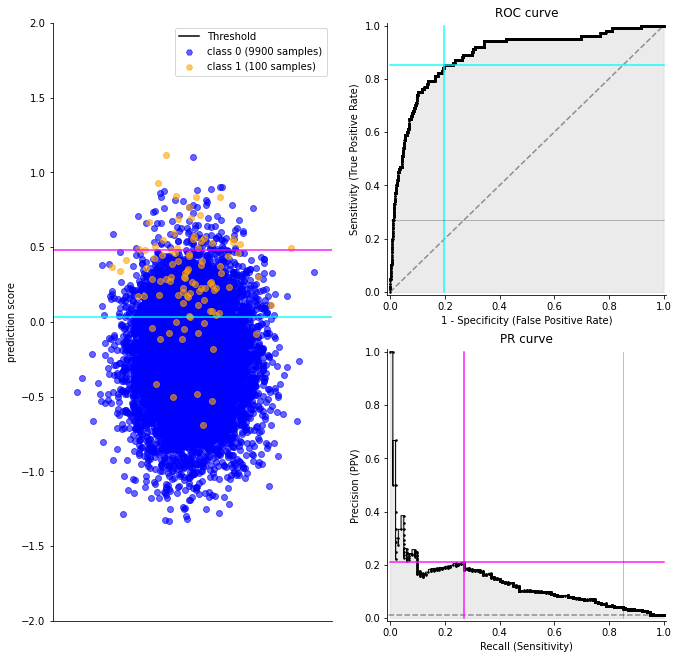
위 그림을 예로들어 설명하면 (분홍색 선과 청록색 선은 threshold를 나타냄),
Recall(=Sensitivity) : 전체 노란 샘플개수 중 분홍색 선 위쪽에 존재하는 노란 샘플개수 비율.
False Positive Rate(= 1-Specificity) : 전체 파란 샘플개수 중 분홍색 선 위쪽에 존재하는 파란 샘플개수 비율.
Precision : 분홍색 선 위쪽에 존재하는 노란색 샘플과 파란색 샘플의 합 중에서 분홍색 선 위쪽에 존재하는 노란 샘플개수 비율.
Recall(=Sensitivity)과 FPR은 threshold가 청록cyan색에서 분홍색 라인으로 올라가도 분자는 바뀌어도 분모(base probability 또는 prior probability)는 그대로이다. 반면, Precision은 threshold가 바뀌면 분모(base probability 또는 prior probability)가 바뀌고 분자도 바뀐다. 위와 같이 imbalanced data인 경우 threshold가 위로 올라가면서 Precision의 분모가 급격히 바뀌게 된다. 위 그림에서 클래스 1인 노란색 샘플이 파란색 샘플만큼 많은 경우를 상상해보자. 즉 파란색 샘플들은 그대로인데, 노란색 샘플들이 prediction score가 대략 [-0.3, 1] 범위에 노란 샘플들이 많이 존재하는 경우다. 그러면 threshold가 올라가면서 Precision의 분모가 급격히 변하지 않고 smooth하게 변할 것이다. 윗부분이 노란색 샘플들이 많으므로. 그러면 threshold가 위로 갈수록 분모와 분자는 거의 비슷한 값을 가질 것이다. threshold가 변함에 따라 Precision이 급격하게 변하지 않는 것이다. 따라서 Precision은 1클래스가 rare한 경우에 민감하여 분류 performance를 잘 반영해준다.
[1] stats.stackexchange.com/questions/7207/roc-vs-precision-and-recall-curves
The key difference is that ROC curves will be the same no matter what the baseline probability is, but PR curves may be more useful in practice for needle-in-haystack type problems or problems where the "positive" class is more interesting than the negative class.
To show this, first let's start with a very nice way to define precision, recall and specificity. Assume you have a "positive" class called 1 and a "negative" class called 0. Y^Y^ is your estimate of the true class label YY. Then:
Precision =P(Y=1|Y^=1)
Recall=Sensitivity =P(Y^=1|Y=1)
Specificity =P(Y^=0|Y=0)
The key thing to note is that sensitivity/recall and specificity, which make up the ROC curve, are probabilities conditioned on the true class label. Therefore, they will be the same regardless of what P(Y=1)P(Y=1) is. Precision is a probability conditioned on your estimate of the class label and will thus vary if you try your classifier in different populations with different baseline P(Y=1). However, it may be more useful in practice if you only care about one population with known background probability and the "positive" class is much more interesting than the "negative" class. (IIRC precision is popular in the document retrieval field, where this is the case.) This is because it directly answers the question, "What is the probability that this is a real hit given my classifier says it is?".
Interestingly, by Bayes' theorem you can work out cases where specificity can be very high and precision very low simultaneously. All you have to do is assume P(Y=1) is very close to zero. In practice I've developed several classifiers with this performance characteristic when searching for needles in DNA sequence haystacks.
IMHO when writing a paper you should provide whichever curve answers the question you want answered (or whichever one is more favorable to your method, if you're cynical). If your question is: "How meaningful is a positive result from my classifier given the baseline probabilities of my problem?", use a PR curve. If your question is, "How well can this classifier be expected to perform in general, at a variety of different baseline probabilities?", go with a ROC curve.
There is a very important difference between what a ROC curve represents vs that of a PRECISION vs RECALL curve.
Remember, a ROC curve represents a relation between sensitivity (RECALL) and False Positive Rate (NOT PRECISION). Sensitivity is the other name for recall but the False Positive Rate is not PRECISION.
Recall/Sensitivity is the measure of the probability that your estimate is 1 given all the samples whose true class label is 1. It is a measure of how many of the positive samples have been identified as being positive.
Specificity is the measure of the probability that your estimate is 0 given all the samples whose true class label is 0. It is a measure of how many of the negative samples have been identified as being negative.
PRECISION on the other hand is different. It is a measure of the probability that a sample is a true positive class given that your classifier said it is positive. It is a measure of how many of the samples predicted by the classifier as positive is indeed positive. Note here that this changes when the base probability or prior probability of the positive class changes. Which means PRECISION depends on how rare is the positive class. In other words, it is used when positive class is more interesting than the negative class.
So, if your problem involves kind of searching a needle in the haystack when for ex: the positive class samples are very rare compared to the negative classes, use a precision recall curve. Othwerwise use a ROC curve because a ROC curve remains the same regardless of the baseline prior probability of your positive class (the important rare class).
[3] towardsdatascience.com/on-roc-and-precision-recall-curves-c23e9b63820c


