말씀하신대로 적당한 파이썬 시계열 분석 책을 저도 못 찾아서 제가 일할 때 공부했던 방법을 공유드립니다 :)
저는 학부에서 R로 시계열분석을 배웠고, 회사에서 개발할 때 저 책으로 시계열 데이터 전처리를 한 다음에 모형 적합 및 시각화는 statsmodels 패키지 및 구글링으로 처리하기는 했습니다. 어차피 모형 적합은 코드 몇 줄이면 되고 전처리가 대다수라서 저 책으로 시계열 데이터를 익숙하게 핸들링 할 수 있다면, 이론을 이미 아는 상태에서는 원하는 분석을 쉽게 하실 수 있을 거에요 :)
아니면 파이썬으로 금융데이터 다루는 책들을 찾아보셔도 되지 않을까 생각해봅니다 :) 본 적은 없지만, 금융데이터도 시계열 데이터니까요
EDIT: Ok, so to summarize for posterity: Statistical inference by Casella Openintro statistics Statistics by David Freedman All of statistics - wasserman Applied statistics by Montgomery And best of all :...The iron of statistic by Walid Miak
Also some courses (which I haven't checked myself):
Some time ago, there was a discussion on a listserv to which I describe regarding statistical software preference. Someone had mentioned a strong preference for the use of R and since that time, I have downloaded the software package (seeing as how it's freeware). However, in looking at the interface, I am at a loss regarding how to actually use the application, and I currently cannot commit the time necessary to pour through the hundreds of help articles or forums. That being said, I looked into some R tutorial books and I wanted to see if anyone has any experience with the books I have listed below or if there are any other recommendations (the ones listed are based on reviews). I am currently gravitating towards Andy Field's book because his writing style is accessible and entertaining, but I also feel that there may be some "wasted chapters" because I already have the SPSS version of his book and I assume that there will be some redundancy. I am also open to the idea that I might need to buy 2 books.
I will likely be conducting traditional statistical analyses (e.g., factor analysis, discriminant function analysis, MANOVA/MANCOVA, ANOVA/ANCOVA, regression), but I would also like to learn how to conduct other analyses through R (e.g., canonical correlation analysis, structural equation modeling, path analysis, time series analysis, etc). I have not used some of these techniques, so a book that includes didactics regarding the nature of these analyses would also be ideal. I appreciate any insight into this. Thank you for your time and I hope everyone has a nice day.
Discovering Statistics using R (Andy Field, Jeremy Miles, & Zoe Field)
The R Book (Michael J. Crawley)
R Cookbook (Paul Teetor)
R for Dummies (Joris Meys and Andrie de Vries) (they have one of these books for everything, don't they?)
Introductory statistics with R (Peter Dalagard)
R by Example (Use R!) (Jim Albert and Maria Rizzo)
I bought the R Book by M.Crawley and find that it was really helpful. It helps you learning how to use the software but also gives some hints in how to run the stats. I am using it over and over every time I am trying to learn some new analyses! I warmly advice it. I also have the R Graphics book but this doesn't really add much to what you would already find in the R Book, unless you want to do advanced quality graphs.
Thomas, just finished up a stint learning R as I had previous knowledge/experience with SPSS and SAS. Found that once the code and structure of R made since, the language is very good. I used as part of the learning process The Art of R Programming, A Tour of Statistical Software Design by Matloff [ISBN-13: 978-1593273842].
This was a strong intro book to get into R.
What I found was really helpful for seeing how to construct some of the more complex models was using a couple tools, Deducer and R Commander. These are GUI packages that extend R and let you do some pretty good modeling with simple point and click but you can see the code generated which helped me learn good practice for using various functions.
A final thought, while your time may be limited, the forums and help articles do provide an additional component in that that discuss various package extensions for R. The true power of R lies in the fact that anyone can write add on packages to extend functionality and there are some great ones out there.
Thank you everyone for your recommendations and feedback! I will definitely set some time aside in the next couple of weeks to start learning how to use this application. Take care and I hope everyone enjoys the rest of their week.
Dear Thomas, I can only agree with Ivan Maggini: Crawley's The R book picks up right at the very basics, but won't let you out in the rain once you get the stats going. This is probably the only book you will need in a very long time... Good luck getting started! S.
Hi Thomas, I encourage you with either Crawley's or Teetor's; they both nicely cover the very basics and provide some advanced applications. You may also check a course on 'Computing for Data Analysis' atcoursera.org, if you wish to get the basic foundations through interactive e-learning. However, and to wrap up, I would suggest Crawley's if you envision to establish a 'long-term relationship' with R. All the best,
It comes with a book written by its main developer and is very suitable for getting an overview of a new dataset. After a session you can see the equivalent R code the Actions on the UI have produced.
Here is a link to a number of books, videos, and guides for learning various aspects of R. This includes data management, statistics,ans visualization.
I found "Discovering Statistics using R" (Andy Field, Jeremy Miles, & Zoe Field) quite helpful, particularly if you need thorough explanations of statistics as well as R programming. The book usually gives very detailed step-by-step instructions of how to perform a test using R, as well as a lot of explanations on the background behind statistical tests. That said, it does contain some errors and inconsistencies, and I usually double-check the information with more reliable sources, depending on the topic. Particularly, for mixed models I recommend Pinheiro and Bates: "Mixed-Effects Models in S and S-PLUS" (as R is basically a further development of S, you can use the same code for R).
I discover in R a nice tools about packages. Instead of trying to learn everything right away, another option would be to learn directly packages that can provides you with a quick hand on tools and then follow with more deeper understanding on your way.
Also be aware that depending of your areas of interest and applications someone would already created a package that you can just apply to your problem.
And the nice thing about R, is that all packages are required to come with the package explanation book who is a nice place to learn about the package and also the function attributes.
Hope you will enjoy learning packages use in R.
this would be a nice place to start looking about Time series packages and it use
Brian Everett's Handbook of Statistical Analysis was where I began to get comfortable with R. I'd also recommend looking at the Journal of Statistical Software, a free online journal, which describes R packages with tutorials on their use.
Just to add some (hopefully) helpful context. My R book is basically the SPSS book but for R, so the examples are the same as is a lot of the theory. Having said that because R is such a different programme to SPSS, there are a lot of differences in approach/structure. The similarities can be good - in that you can replicate the examples that you know in SPSS but using R. As a learning tool this might be useful. It might also be a lot of pointless redundancy - depends how you look at it -. Different people will see it as a plus or a minus I suspect. Otherwise, I think Crawley's R book is very good and thorough, the website quick R is also great. R for dummies is extremely good for getting to grips with the R interface and manipulating data etc - it's probably he best book i have seen for this- but covers less applied stats as you might expect. I'm not familiar enough with the other books to comment.
Thank you again everyone for the helpful advice, perspectives, and recommendations! It looks like I'll be going through some of the free materials and buying a couple of different books. Cheers!
Andy Field wrote: "My R book is basically the SPSS book but for R, so the examples are the same as is a lot of the theory."
If that is so, that book would be worth looking into. The SPSS book is probably the most pleasant statistics book I've read and I learned a lot from it.
Hi Mitchell and Phillip: thanks for this answer. I had a look at some of the chapters (free download compare link below for chapter 1 from cran r). Is that similar to the textbook?
It's similar in that it covers some basics. The book has a lot more explanations. For example, it starts off with an extensive review of the help functions across mac, PC, and linux. Although the information in the link you cite is accurate, the book's more designed to get you up and running quickly with a lot of explanations along the way. It's a little like having someone thoroughly explain the interface. I think it's worth the money (I just ordered it as a Nook book recently).
Thanks Phillip, sounds really good. Please tell me more when you have the book. I had a download link this morning but unfortunately my university does not support that database otherwise I would owe it now :(
One more thing, for a more advanced user who already knows the basic operations: I learned *a lot* of R just by reading the fabulous manuals, reference manuals and studying the provided examples. Also, many packages contain vignettes or manuals, which are often v.v. good (in fact, many of them with time turned into actual books). Use the "?" and "??" from R command line a lot.
Hi January, thanks for that tipps. Actually I use the manuals as my first reference, as second the blocks. But yours sound better, I bookmark both (I just googled). What I now learned from you are two things: the "?" and the Cookbook. I had a look at it, it looks good. Thank you so much. I also looked at Mark Gardener: beginning R.
To start with i would consulate An Introduction to R which can be found athttp://cran.r-project.orgits free and gives you everything you need to get started. I would the suggest you move on tothe R Cookbook by Paul Teetor its a good guide but also acts as a good reference guide even for advanced users.
Also the guides on the R site can be a bit hit or miss but some are excellent.
I also like the books from Pfaff and his procedures, just for those who seek more alternatives :) Also some universities have an R team as for example ETH Zurich or Institute for Statistics of University Bern. So much from my side.
I know what tour feeling is like. I've been through it too. R is incredible and very versatile but at the "first date" it looks a bit cryptic. Personally, the 'R Book' is well done because example of scripts and, above all, explanations about the R outcome, which is not to underestimate! I reckon that book is a good starting point. Based on the aim of your analysis, probably you will need more reference from either other books or the R packages manuals. It's hard at the beginning but do not give up!
otherwise the R book by Crawley is great. Plus you can learn so much from all the resources online, esp stackoverflow. The atmosphere can be a little hostile sometimes towards new users, but as long as you demonstrate that you've tried some things, have done some reading and give reproducible code you're covered!
You can refer the guidance document of 'Biodiversity R'. It has got some advanced techniques. Also have a look at 'Applied Spatial Data Analysis with R' by Roger S. Bivand . Edzer J. Pebesma.
Considering the coverage you are looking for, I recommend "Numerical Ecology with R", by Daniel Borcard, François Gillet and Pierre Legendre, published in 2011 in the series "Use R!", Springer, XI + 306 pp. The examples are mainly from ecology, but the book leads you step by step through the application of most major techniques of multivariate data analysis. Seehttp://adn.biol.umontreal.ca/~numericalecology/
Many thanks, Sarah-Jo. It was helpful - R for SAS users, exactly what I needed! I rather use Google and other Internet possibilities than books. Books are expensive!
If you are using R outside of the world of statstics, I would recommend "The Art of R Programming" by Norman Matloff as a good reference for writing much more computationally and memory efficient R code.http://nostarch.com/artofr.htm
I would think Andy Field's text matches what you're looking for pretty exactly. You can always skip the bits you read in his SPSS version - I find there's lots I skip in his writing anyway :-)
Then it is a matter of reading the manuals of particular Packages you would instal when wanting to do something specific. that documentation which comes with R packages usually offer usefull examples.
Well, I see a plenty of extremely helpful suggestions here. But I would like to share my experience as a beginner of R during August 2011. The only things you need to learn as a beginner of R are:
1. The R operators.
2. The R object types and how to generate, coerce and exchange between them.
3. The R functions and how to write them with arguments.
And to learn them you don't need any book, they are well documented in "An Introduction to R" (http://www.r-project.org/) (someone has mentioned it already). The application of R became so diversified and out-reaching that you might only need book to learn very specific application oriented R programing. But what I do is typing in google what exactly I need to do in R. Believe me or not there are 100s of webpages waiting to help you and that yields far better results than digging into a book.
All the books mentioned above are really helpful but I do find the R book by Michael Crawley a real treasure. Not only it is helpful in learning R but it has also helped me get valuable insight on some statistical concepts. It is updated with some of the newest concepts in classification and data mining too.
Two books that illustrate how to use R when using ANOVA, MANOVA, ANCOVA and various regression methods are Wilcox (2012, Modern Statistics for the Social Sciences) and Wilcox (2012, Introduction to Robust Estimation and Hypothesis Testing). A possible appeal of these books it they also include modern robust methods that can substantially increase power when standard assumptions are violated.
To a beginner what I am suggesting is to start with R Commander package with R. Since this is menu driven this will act as a bridge from earlier software that you used to R. Using this package you can perform many basic statistics. Then use Quick R website (http://www.statmethods.net/) to understand some basic codes. In this stage one can read other relevant R books to understand the advanced features of R.
Duda please look at German Rodriguez's Introducing R athttp://data.princeton.edu/R. It simplifies R to the benefit of a beginner. It is one the materials that helped me conquer R.
If you already have experience managing data sets and doing statistical analysis in SAS or SPSS, examine the book "R for SAS and SPSS Users" by Robert Muenchen. He also wrote one for STATA users. Then get the book for you application, such as MANOVA.
I notice you also mention that you found the R "interface" a bit intimidating and that it was difficult to figure "how to actually use the application" ! You might find that RStudio (http://www.rstudio.com/ide/download/) helps you get over that obstacle. No doubt R gurus would spurn it in favor of Emacs (e.g.http://ess.r-project.org/) or some even plainer text editor, but it does make things much easier for a beginner, and is much more similar to programs you are familiar with such as SPSS and SAS.
I highly recommend Visualize This by Nathan Yau. Both this book and the author's blog, FlowingData contains lots of tutorials about using R in order to do some good statistics. Check a look at the blog and then decide! Cheers!!!
Yet another useful book is Using R for Introductory Statistics by John Verzani.
For more depth (regarding statistical methods) I recommend the "MASS" book (Modern Applied Statistics with S) by Ripley and Venables. (The S in the title refers to the language; the book is intended for both of its main implementations, the programs Splus and R.)
Note also that many R programs are accompanied by detailed instructions and papers with tutorials.
I'd agree that "Statistics. An introduction using R" by M. Crawley is very useful, both to learn R and understand statistics. It explains the fundamentals of the statistics and walks you through the R code.
Rstudio is a good interface (GUI), and R in Action (Kabacoff,R) and A Handbook of Statistical Analysis Using R (Everitt,BS; Hothorn, T) are excelent books.
Apart the books available in the R website (http://www.r-project.org, manual section), I started my adventure with R with the very useful Peter Dalgaard's book.
"Introductory Statistics with R" - Springer Editor
It will guide you from the basics of R and statistics until more advanced analysis.
Learning R is about practice, searching, trial and error. When you encounter a problem, Google is often the first choice. You will find answers quite often inhttp://stackoverflow.com/.
For the books, I think R in Action is a great reference, not only for statistics but also for data visualization. The book is systemically written and well-organized. The content covers the basic statistics and intermediate methods such as regression, permutation tests, generalized linear model, PCA, and dealing with missing data. At the same time, its companion website is also very useful:http://www.statmethods.net/. If you have already been familiar with the basic statistics, I think it's a nice start for you to practically learn R and use it!
And I'm still getting great recommendations! Thanks everyone so much for your time in responding to my question. Learning R will be one of my primary projects over winter break. Thank you again! :)
As one of the authors of R for Dummies, I'm bound to suggest that one to you as well. But I'd like to add a sidenote: R for Dummies looks at R from a programming point of view, not so much a statistical point of view.
We chose to take "the other route" as I have daily experience with the problems that arise due to copy-pasting solutions from other people without understanding the underlying structure of the objects and how to work with them. Yet, as R _is_ first and foremost a programming (scripting) language, you need a fair idea about how to work with the objects.
I get R users at my desk that even with more than 3 years of experience still don't know eg that a data frame is a list and not a matrix, and especially don't grasp the consequences of this fact.
As I noted to some critics before, everything you need to learn R is to be found for free on the internet. R for Dummies is merely a (hopefully useful) summary in a sequence we deemed suited to learn R from scratch.
But whatever you do, don't copy code you don't understand, and spend a fair amount of time figuring out the programming aspects, not only the statistical aspects of R.
I strongly recommend 'Using R as an Introductory Statistics' by John Verzani. I used it when learning R and it provided me with strong basis. Very good to teach you the R language and stats at the same time.
Georgia Southern University, Jiann-PIng Hsu College of Public Health
Try Clinical Trial Data Analysis with R by Din Chen and Karl Peace, published by Chapman/ Hall Biostatistics Series. You may also want to consider Applied Meta Analysis Using R, also by Chen and Peace and published by Chapman Hall Biostatistics Series.
I have used the Daalgard book, and I find it to be very helpful. Another book is "R in a Nutshell", by Joseph Adler, is a helpful reference, but don't expect to learn R from it.
Do any of the books have explanations with examples for things like generating permutation distributions or even MCMC methods?
Hi there! I discovered R by taking the Statistics, Data Analysis and Computing for Data Analysis classes onwww.coursera.org. I think the interactions and also the course materials and resources (some of which named above) would add value and more depth to your endeavour rather than only taking a book page by page. Good luck with your work!
If you're already comfortable with the statistics then I would not recommend Andy Field's book because (a) it focuses primarily on the statistics, spending much time (i.e., pages) on trying not to scare students away, and (b) it does not introduce R in the easiest possible way but tries to adapt R usage to the requirements of an SPSS stats book, resulting in examples that may start off scarier than necessary. I prefer a more bare-bones initial approach R, with a minimum of functions and external libraries, focusing on how simply and coherently you can get basic stuff done.
I concur with recommendations for online introductions, such as tutorials marked "for psychologists" and such in the "under 100 page" section of the R contributed documentation pages.
Having said that, I do recommend Field's book for someone who also needs to learn the stats starting at the beginning, for the well-known reasons that have made Field's book so popular with students.
Ministero dell'Istruzione, dell'Università e della Ricerca
For time series analysis I suggest you the book of Shumway and Stoffer. For regression the newest book of Fahrmeir et al, "REGRESSION", which has a lot of updated example in R, STATA and other packages. For simple programmingwww.datamind.org.
Thomas, if you haven't already, I would recommend downloading R-Studio which is a popular 'integrated development environment'. It includes lots of features that make using R easier including adding in additional packages which is a common task.
I would recommend r in a nutshell by Adler and intro stat with R by Dalgaard. Both are so helpful. QuickR website is also a good source for elementary level.
Murray Logan's Book (Practical Design and Analysis Using R: A practical guide) is fine to began an introduction to R. For multivariate analysis (PCA, CCA, RDA,...) I can suggest you try the website of ade4 package, but the problem, may be, it is in French. However, there is the adelist, that is a mailing list used to announce news about the ade4 package for R, and to allow users to exchange informations. For the time serie analysis, you have Woods' Book on Generalized Additive Models in R. You have also a R-tutorial, of ~20 pages, about the time series analysis with R (Zucchini and Nemadé, Time series analysis with R - part I). You can go to see also athttp://a-little-book-of-r-for-time-series.readthedocs.org/en/latest/src/timeseries.html.
R has a tremendous number of resources you can use. In this sense I suggest to go to the Contributed Documentation in the CRAN website (see Manuals\Contributed Documentations at bottom of the page):
Here you can find surely guide for the majority of the statistical techniques you are planning to use. Please consider that sometime you can need some other tutorials or guides so my suggestion is to be aware on the powerful search engines which allow to find statistical techniques of interest. So you can use:
Last but not least you can use from the package "sos" a function: findFn which allow to search of the method (for example) in the various package it is possible to install.
Uniformed Services University of the Health Sciences
Dear Thomas, I second Xuanlong's recommendation for the "Intro to R tutorial". It summarizes very important basics. There is a Youtube video that covers the Intro to R at
With just these basics behind you, and as with any programming language, the best way to learn is to start programming on a problem that interests you. Regardless of what platform you use, you should have two windows open, at least, one interactive and one text editor. This can be done many ways: Rstudio to emacs... Use the manual: "?plot", "?randomForest", etc. Every manual page has one or more examples that you can run. This, in my opinion, is the best text.
dplyr 패키지에서 제공하는 파이프 기능, summarise() 함수를 통한 기술통계량 구하기, group_by() 함수를 이용하여 집단별 처리, arrange() 함수를 이용하여 데이터를 정렬하는 내용을 다루고 있습니다.
[ 이부일의 R릴레오 ] #R강의 028 : dplyr 패키지를 이용한 데이터 합치기
dplyr 패키지에서 제공하는 inner_join(), full_join(), left_join(), right_join() 함수를 이용하여 데이터를 합치는 내용입니다.
[ 이부일의 R릴레오 ] #R강의 029 : dplyr 패키지를 이용한 semi join과 anti join
dplyr 패키지에서 제공하는 semi_join() 함수와 anti_join() 함수를 이용하여 데이터를 합치는 내용입니다.
[ 이부일의 R릴레오 ] #R강의 030 : 모집단과 표본
모집단, 표본의 대한 개념, 전수조사(총조사, 센서스)와 표본조사의 개념에 대해서 간략히 소개하는 내용입니다.
[ 이부일의 R릴레오 ] #R강의 031 : 분포(Distribution)
모집단의 분포가 어떻게 생겼는지를 표본을 뽑아서 추론하는 내용입니다.
[ 이부일의 R릴레오 ] #R강의 032 : 정규분포의 개념
모집단의 분포 중에서 가장 유명한 정규분포에 대한 개념을 간략히 설명하고 있습니다.
[ 이부일의 R릴레오 ] #R강의 033 : R을 이용하여 정규분포에서 확률구하기
R을 이용하여 정규분포에서 난수 생성하기, 누적확률 구하기, 확률변수값 구하기, 밀도 구하는 내용입니다.
[ 이부일의 R릴레오 ] #R강의 034 : 표본평균의 분포
표본평균의 분포에 대해서 짧게 설명한 내용입니다.
[ 이부일의 R릴레오 ] #R강의035 : 왜 분포를 알아야 하는가?
분포의 중요성을 설명하고 있습니다.
[ 이부일의 R릴레오 ] #R강의036 : 가설이란?
가설의 개념, 가설의 종류로 귀무가설과 대립가설을 다루고 있습니다.
[이부일의 R릴레오 ] #R강의037 : 유의수준이란 무엇인가? 01
가설검정에서의 유의수준에 대한 개념을 간략히 설명하고 있습니다.
[ 이부일의 R릴레오 ] #R강의038 : 유의수준이란 무엇인가?(02)
유의수준의 개념을 분포를 이용하여 설명하고 있습니다.
[ 이부일의 R릴레오 ] #R강의039 : 유의수준이란 무엇인가?(03)
가설검정에서의 유의수준 개념을 그림으로 설명하고 있습니다.
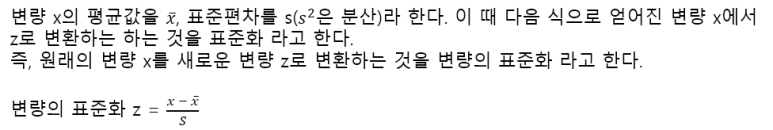
[ 이부일의 R릴레오 ] #R강의040 : 정규분포의 표준화
정규분포를 따르는 값들을 표준화하면,
표준화된 값들은 평균이 0이고 표준편차가 1인 표준정규분포를 따른다는 내용입니다.
[ 이부일의 R릴레오 ] #R강의041 : 유의확률이란 무엇인가?01
가설검정에서 표준정규분포에서의 유의수준과 유의확률의 개념을 설명하고 있습니다.
[ 이부일의 R릴레오 ] #R강의042 : 유의확률이란 무엇인가?02
가설검정에서의 유의확률 개념을 설명하고 있습니다.
[ 이부일의 R릴레오 ] #R강의043 : 일표본 t검정
하나의 모집단의 평균이 기존에 알고 있었던 것보다 커졌는지, 작아졌는지, 달라졌는지를 검정(분석)하는 일표본 t검정(One sample t-test)에 대한 내용을 다루고 있습니다.
[ 이부일의 R릴레오 ] #R강의044 : R을 이용한 일표본 t검정
R을 이용하여 일표본 t 검정(One sample t-test)을 하는 내용입니다.
[ 이부일의 R릴레오 ] #R강의045 : R을 이용한 윌콕슨의 부호 순위 검정
일표본 검정에서 비모수적 방법인 윌콘슨의 부호 순위 검정(Wilcoxon's signed rank test)을 소개하고 있습니다.
[ 이부일의 R릴레오 ] #R강의046 : R을 이용한 일표본 검정
정규성 검정과 정규성 검정 결과에 따라 정규성 가정을 만족하면 One sample t-test, 정규성 가정이 깨지면 Wilcoxon's signed rank test하는 것으로 7개의 양적 자료에 대한 결과를 for문을 이용하여 한 번에 진행하고, 그 결과를 엑셀 파일에 저장하는 내용입니다.
[ 이부일의 R릴레오 ] R강의047 : R을 이용한 일표본 검정에 대한 Flow Chart
R을 이용하여 일표본 검정을 진행할 때에
이해하기 쉽도록 Flow Chart를 작성해 보았습니다.
[ 이부일의 R릴레오 ] #R강의048 : 독립 2표본 검정(01)
독립 2표본 검정에 대한 이론적인 내용입니다.
[ 이부일의 R릴레오 ] #R강의049 : 독립 2표본 검정(02)
독립 2표본 검정의 내용으로 등분산이 가정되었을 때와 이분산이 가정되었을 때의 독립 2표본 검정의 내용을 다루고 있습니다.
[ 이부일의 R릴레오 ] #R강의050 : 독립 2표본 검정(03)
독립 2표본 검정에서 등분산 검정에 대한 내용입니다.
[ 이부일의 R릴레오 ] #R강의051 : 독립 2표본 검정(04)
R을 이용하여 다음의 내용을 실습하는 내용입니다.
1. 정규성 검정
2. 등분산성 검정
3. 등분산이 가정된 Two sample t-test
4. 이분산이 가정된 Two sample t-test
[ 이부일의 R릴레오 ] #R강의052 : 독립 2표본 검정(05)
독립 2표본 검정에서 정규성 가정이 깨졌을 때에 사용하는 비모수적 방법(Non-parametric method)인 윌콕슨의 순위합 검정(Wilcoxon's rank sum test)에 대한 이론을 간략히 설명하고 있습니다.
[ 이부일의 R릴레오 ] #R강의053 : 독립 2표본 검정(06)
R을 이용하여 윌콕슨의 순위합 검정(Wilcoxon's rank sum test)을 하는 내용입니다.
[ 이부일의 R릴레오 ] #054 : 독립 2표본 검정(07)
R을 이용하여
정규성 검정을 하고, 정규성 가정을 만족하면 등분산 검정을 하고,
등분산 가정이 되면 등분산이 가정된 Two sample t-test,
이분산 가정이 되면 이분산이 가정된 Two sample t-test,
정규성 가정이 깨지면 Wilcoxon's rank sum test를 하는 프로그램을 작성하는 내용입니다.
[ 이부일의 R릴레오 ] #R강의055 : 대응 2표본 검정(01)
동일한 집단의 사전의 양적 자료와 사후의 양적 자료에 통계적으로 유의한 차이가 있는지를 분석하는 내용으로, 정규성 가정이 만족되었을 때에 하는 대응 2표본 검정(Paired t-test)을 소개하고 있습니다.
[ 이부일의 R릴레오 ] #R강의 056 : 대응 2표본 검정(02)
동일한 대상자의 사전과 사후의 양적 자료에 통계적으로 유의한 차이가 있는지를 검정하는 Wilcoxon's signed rank test에 대한 내용으로 (사전-사후)의 값이 정규분포를 따르지 않을 때에 사용하는 방법입니다.
[ 이부일의 R릴레오 ] #R강의 057: 대응 2표본 검정(03)
정규성 가정이 만족할 때에 R을 이용하여 대응 2표본 t검정(Paired t-test)을 실습하는 내용입니다.
[ 이부일의 R릴레오 ] #R강의 058: 대응 2표본 검정(04)
R을 이용하여 대응 2표본 검정에서 정규성 가정을 만족하지 않을 때에 하는 Wilcoxon's signed rank test를 실습하는 내용입니다.
[ 이부일의 R릴레오 ] #R강의 059 : 대응 2표본 검정(05)
대응 2표본 검정으로 R을 이용하여 정규성 검정을 하고, 정규성 검정 결과에 따라 Paired t-test 또는 Wilcoxon's signed rank test하는 과정을 R로 실습하는 내용입니다.
[ 이부일의 R릴레오 ] #R강의 060 : 분산분석01
독립인 3개 이상의 모집단의 양적 자료에 통계적으로 유의한 차이가 있는지를 검정하는 분산분석에 대한 이론적인 내용입니다.
[ 이부일의 R릴레오 ] #R강의 061 : 분산분석02
독립인 3개 이상의 모집단의 양적 자료에 통계적으로 유의한 차이가 있는지를 검정하는 분산분석에 대한 이론적인 내용으로 SST = SSE + SSB에 대한 개념을 추가적으로 설명하고 있습니다.
[ 이부일의 R릴레오 ] #R강의 062 : 분산분석(03)
일원배치 분산분석(One way ANOVA)에 대한 이론적인 개념을 설명하는 것으로, F 검정통계량와 F분포를 설명하고, 이것을 이용하여 분산분석에 대한 가설검정을 하는 내용을 설명하고 있습니다.
[ 이부일의 R릴레오 ] #R강의 063 : 분산분석04
일원배치 분산분석으로, R을 이용하여 집단별 정규성 검정, Bartlett 또는 Levene의 등분산 검정, oneway.test(), aov() 함수를 이용한 분산분석을 하는 내용을 다루고 있습니다.
[ 이부일의 R릴레오 ] #R강의 064 : 분산분석05
분산분석의 내용으로 집단 간에 통계적으로 유의한 차이가 있다고 결론이 내려졌을 때에 어느 집단과 어느 집단 간에 유의한 차이가 있는지를 분석하는 다중비교(또는 사후분석)에 대한 R 실습 내용입니다.
[ 이부일의 R릴레오 ] #R강의 065 : 분산분석06
중비교(또는 사후분석) 방법으로
agricolae 패키지에서 제공하는 Tukey와 Duncan 방법을 R로 실습하는 내용입니다.
[ 이부일의 R릴레오 ] #R강의 066 : 분산분석07
정규성 가정이 깨졌을 때에 사용하는 Kruskal-Wallis rank sum test에 대한 이론적인 설명입니다.
[ 이부일의 R릴레오 ] #R강의 067 : 분산분석08
정규성 가정이 깨졌을 때에 사용하는 Kruskal-Wallis rank sum test을 R로 실습하는 내용입니다.
[ 이부일의 R릴레오 ] #R강의068 : 상관분석01
두 개의 양적 자료 간의 관련성(직선의 관계 = 선형의 관계)이 있는지를 시각적으로 보는 산점도에 대한 개념과 R을 이용한 실습한 내용입니다.
이부일의 R릴레오 ] #069 : 상관분석02
두 개의 양적 자료 간의 관련성(직선의 관계 = 선형의 관계)의 정도를 수치로 알려주는 상관계수(coefficient of correlation)를 설명하는 내용입니다.
[ 이부일의 R릴레오 ] #070 : 상관분석03
두 개의 양적 자료 간의 관련성(직선의 관계 = 선형의 관계)의 정도를 수치로 알려주는 상관계수(coefficient of correlation)입니다.
[ 이부일의 R릴레오 ] #071 상관분석04
두 개의 양적 자료의 선형(직선)의 관계가 어느 정도인지를 알아보는 방법으로 두 개의 양적 자료가 정규성 가정이 깨지거나 순위형 자료로 왔을 때에 사용하는 방법 중의 하나인 Kendall의 상관계수에 대한 개념을 설명하고, R로 실습하는 내용입니다.
[ 이부일의 R릴레오 ] #072 상관분석05
두 개의 양적 자료 간에 통계적으로 의미 있는 상관관계(직선의 관계 = 선형의 관계)가 있는지를 검정하는 상관분석입니다.
[ 이부일의 R릴레오 ] #073 : 회귀분석01
어떤 양적 자료(들)가 다른 양적 자료에 통계적으로 유의한 영향을 주는지를 분석하는 회귀분석 내용을 다룹니다. 회귀분석을 인과관계, 즉 원인과 결과의 관계가 있는지를 분석한다고 얘기할 수 있다. 예측의 가장 기본이 되고 가장 많이 사용하는 분석 방법 중의 하나입니다.
[ 이부일의 R릴레오 : 074회 ] # 회귀분석02
회귀분석으로
종속변수(반응변수, label), 독립변수(설명변수, feature), 절편(intercept), 기울기(slope), 오차(error), 회귀계수(coefficient of regression), 회귀모형(regression model), 최소제곱법을 통한 회귀계수를 구하는 과정을 짧게 다루고 있습니다.
[ 이부일의 R릴레오 ] #075 : 회귀분석03
회귀분석으로 회귀모형의 타당성 검정에 대한 이론적인 내용입니다.
SST, SSE, SSR, MSE, MSR
[ 이부일의 R릴레오 ] #076 : 회귀분석04
회귀분석으로
회귀계수(기울기)에 대한 유의성 검정으로
독립변수(X)가 종속변수(Y)에게 통계적으로 유의한 영향을 주는지를 검정하는 내용입니다.
[ 이부일의 R릴레오 ] #077 : 회귀분석05
회귀분석으로 회귀모형의 설명력(or 독립변수의 설명력 or 결정계수)에 대한개념을 소개하는 내용입니다.
[ 이부일의 R릴레오 ] #078 : 회귀분석06
R를 이용하여 단순선형 회귀분석을 하고, 회귀모형의 타당성, 독립변수의 유의성 검정을 해석하는 내용입니다.
[ 이부일의 R릴레오 ] #079 : 회귀분석07
R를 이용하여 단순선형 회귀분석을 하고, 회귀분석의 결과를 해석하는 내용으로 다음을 다루고 있습니다.
제가 현재 약 40만건의 데이터를 활용해서 가설 검정(5그룹간 평균차이분석)을 하려하는데요~ 샘플사이즈가 너무 커서 검정력이 너무 세질까봐 Gpower를 이용해서 표본을 추출하였습니다.
여기서 질문이 몇가지 있는데요.
1. 검정력 ANOVA나 Kruskal-wallis 모두 공식을 보았을때 n이 커지면 검정력이 높아질 것으로 보이는데 맞는지요?!
2. sample size sample size를 추출할때 power, alpha, effect size(중간), 그룹의 수를 이용하는데, 제가 생각했을때는 power를 0.8로 지정하면 sample size가 너무 작아 표본을 대표할 수 없다고 생각이 들어 0.95로 설정하였습니다. 이것이 문제가 될까요? 혹시 문제가 된다면 어떤 값을 넣는것이 알맞을지 궁금합니다.
3. 표본의 대표성 총 40만건의 데이터 중 위의 설정한대로 추출하면 1700~1800(정확히 기억은 안납니다ㅠ)으로 그룹당 350?건 정도로 나타나는데요. 이렇게 샘플사이즈를 작게 책정하였을때 표본의 대표성이 떨어지는 문제가 발생할것으로 보이는데 이럴때는 어떻게 해야하나요?
4. 가설검정 다섯그룹의 평균차이검정을 실시하기위해 위의 샘플수를 추출한 뒤에 정규성검정을 시행하였는데 위배되었습니다. 따라서 비모수적인 방법을 사용하였는데요. 랜덤샘플링에 따라 결과가 어떻게 나타나는지 비교하기위해 10개의 데이터셋으로 샘플추출하여 분석하였는데요. 대부분의 경우 H0를 채택하였지만 간혹 H0를 기각하는 경우가 발생해서요. 이것도 표본의 대표성 문제인가요?!
계층형 데이터 (hierarchical data)을 가지고 테스트를 진행할때 (regression coefficient) 테스트의 검증력 (power)을 계산하려고 합니다.
구글링을 하다가 Snijders분의 2005년 논문을 읽게 되었는데 (Power and sample size in multilevel modeling) 제일 위 레벨의 표본 크기가 제일 중요하다고 되어있더라고요. 제일 위 레벨의 표본이 충분한 검증력을 가지고 있다면, 아래 레벨의 검증력은 따로 구하지 않아도 된다는 걸까요?
G power나 SPSS를 통해 제일 위 레벨 검증력만 계산하면 될까요? 아니면 제가 잘못 이해한걸까요 ㅠㅠ
도움에 미리 감사드립니다 🙂
상대적으로 윗 level power가 주로 문제가 된다는 뜻이지 아래 level power를 전혀 고려하지 않아도 된다는 뜻은 아닙니다. 아래 level 독립변수가 너무 많으면 전체적으로 문제가 발생합니다. 최하층 레벨 (level 1)의 평균 sample size와 그 level 독립변수의 숫자를 고려해 보셔요. HLM 혹은 Multilevel model도 결국 multiple linear regression의 확장이니 그 기본으로 돌아가 해결해 나가시면 도움이 될꺼에요,
유의확률 (p-value) 영가설이 맞다고 가정할 때 얻은 결과 보다 극단적인 결과가 실제로 관측될 확률이다. 보통 0.05%의 유의 확률을 사용한다.
편차 (deviation) 평균과 관측값의 차이
분산 (variance) 편차의 제곱의 평균
표준편차 (standard deviation) 분산의 양의 제곱근
표준정규분포 (standard normal distribution) 평균은 0이고 표준편차가 1인 정규분포
정규분포 (normal distribution or 가우시안 분포: Gaussian distribution) 통계학에서 연속 확률 분포 중의 하나다.
T-Test 단일표본 T검정 독립표본 T검정 대응표본 T검정
Z-Test 모집단의 분산을 알고 있는 경우 사용
산포도(degree of scattering) 자료의 흩어진 정도 분산, 범위, 사분위수범위 등이 해당한다.
범위(range) 자료의 가장 큰값과 가장 작은값 간의 차이, 외부 특이점(Outlier)에 대한 처리가 필요하다.
사분위수(quartiles) 측정값을 정렬해서 4등분으로 나눈 것을 말한다.
모집단(population) 정보를 얻고자 하는 관심 대상의 전체 집합이다.
모수 (Parameter) 모집단의 특성을 기술하는 특정한 값을 말한다.
신뢰 구간 (confidence interval) 모수가 어느 범위 안에 있는지를 확률적으로 보여주는 방법이다.
정규성 검정 표본수 > 30 : 중심극한정리에 의해 정규성을 가지는 것으로 가정할 수 있음 30 > 표본수 > 10 : 정규성 검정 필요 10 > 표본수 : 정규성을 인정 받을 수 없음으로 비모수적인 통계 방법 사용
정규성 검정 방법 Kolmogorov-Smirnov test : 샘플의 수가 2000개 이상일때, Sapiro-Wilks test : 샘플의 수가 4 - 2000개 이하일때,
모수적 방법 (Parametric) 표본 평균 검증 T 검정, Z 검정 표본 분산 검정 F 검증, 카이제곱 검정
비모수적 방법(Non-parametric) 정규분포가 아니거나 표본의 수가 적을때 사용 부호 검정 (Sign test) 관측치들 간에 크다 작다 혹은 같다라는 주장이 사실인지 검정 윌콕슨 부호 순위 검정 부호뿐만 아니라 관측치 간의 차이의 크기, 순위까지 고려하여 검정 크루스칼-왈리스 검정 3개 이상 집단의 중앙값 차이를 검정
외도 (Skewness) 크다 : 오른쪽 롱꼬리
첨도 (kurtosis) 크다 : 위로 솟다.
검정 통계량 (or 표본 통계량) 모집단 전체 조사가 힘든 경우 검정하기 위한 표본을 통계한다.
확률 분포 정규 분포, T 분포, 카이제곱 분포, F 분포 확률 분포 그래프의 X 좌표를 구한다.
확률 분포 (probability distribution) 확률 변수가 특정한 값을 가질 확률을 나태내는 함수를 의미한다.
이산 확률분포 (distribute of discrete random variable) 이산 확률 변수가 가지는 확률분포를 의미한다.
** 이산 확률 변수 (discrete random variable)
연속 확률분포 (continuous probability distribution) 확률 밀도 함수를 이용해 분포를 표현할 수 있는 경우를 의미한다.
** 연속 확률 변수 (continuous random variable)
확률 밀도 함수 (probability density function, PDF) 확률 변수의 분포를 나타내는 함수이다.
확률 질량 함수 (probability mass function, PMF) 이산 확률 변수에 의한 확률 분포 함수를 의미한다.
누적 분포 함수 (cumulative distribution function, CDF) 확률 변수가 특정 값보다 작거나 같은 확률을 나타낸다.
이항 분포 (binormial distribution) 연속된 n번의 독립적 시행에서 각 시행이 확률 p를 가질 때의 이산 확률 분포이다.
확률 변수 (random variable) 어떤 시행의 결과로 나타나는 각각의 실수값이다.
다항식 (polynomial) 1개 이상의 항으로 이루어진 식을 말한다.
다항식의 차수 (degree of polymormial) 각 항의 각 문자의 자수를 합친 것 중 가장 큰 값을 해당 다항식의 차수라 한다. 예) x^2 * y^3 은 5차수
X차 방정식 최고차 항의 차수가 X인 다항 방정식을 뜻한다.
방정식 (equation) 특정한 문자의 값에 따라 참/거짓이 결정되는 등식이다. 이때, 방정식을 참이 되게 하는 특정 문자의 값을 해(근)이라 한다.
실수 유리수 / 정수 (음, 양, 0) , 정수가 아닌 유리수 (유한 소수, 순한 소수) 무리수 / 순한하지 않는 소수
이산 수학 (Discrete mathematics) 이산적인 수학 구조에 대해 연구하는 학문으로, 연속되지 않은 공간을 다룬다.
◆ 통계학 (Statistics) 수량적 비교를 기초로 하여 많은 사실을 통계적으로 관찰하고 처리하는 방법을 연구하는 학문이다. 근대 과학으로서의 19세기 중반 벨기에의 케틀레가 독일의 “국상학(Staaenkunde, 넓은 의미의 국가학)”과 영국의 “정치 산술(Political Arithmetic, 정치 사회에 대한 수량적 연구 방법)”을 자연과학의 “확률 이론”과 결합하여 수립한 학문에서 발전되었다.
◆ 기술통계학 (Descriptive Statistics) 측정이나 실험에서 수집한 자료의 정리, 표현, 요약, 해석 등을 통해 자료의 특성을 규명하는 통계적 방법이다. ◆ 추리통계학 (Inferencial Statistics) 모집단에서 뽑은 표본을 분석하여 이를 기초로 모집단의 특성을 규명하는 통계적 방법이다. ◆ 통계추론 (Statistical Inference) 관심 대상인 집단에 대해 조사한 결과로 부터 일관성을 찾아내고 불확실한 사실에 대한 결론이나 예측을 하는데 필요한 이론과 방법 ◆ 연속데이터 (Continous Data) 키, 체중, 시간, 혈압, 경제성장률 등과 같이 연속적인 수치로 나타낼 수 있는 데이터 ◆ 이산데이터 (Discrete Data) 주사위 숫자, 학번, 연령 등과 같이 연속적이지 않은 수치로 나타내는 데이터 ◆ 질적데이터 (Qualitative Data) 좋다 '1', 그리 좋지않다 '2', 싫다 '3' 등과 같이 범주 또는 순서 형태의 속성을 가진 데이터 ◆ 양적데이터 (Qualitative Data) 온도, 시각, 키, 체중, 시간 등과 같이 관측된 데이터의 값이 수치 형태의 속성을 가진 데이터
◆ 모집단 (Population) 분석의 대상이 되는 어떤 기본 단위의 변수에 관하여 수집한 관찰 값들의 집합이다.
◆ 모수 (Parameter) 모집단의 어떤 특성을 기술하며 모수 값은 그 모수를 특정 값으로 표현한 값이다. ◆ 표본 (Sample) 전체 모집단의 축도 또는 단면이 된다는 가정 하에서 모집단에서 선택된 모집단 구성단위의 일부 ◆ 통계량 (Statistics) 표본의 특성을 수치로 나타내는 것을 통계량이라 한다. ◆ 중앙값 (Median) 변량의 값을 크기 순으로 늘어놓았을 때 중앙에 오는 수치로 데이터의 크기가 짝수일 경우는 한 가운데 2개를 취하고 이들 2개로 나눈 수치를 중앙값으로 정한다. ◆ 최빈값 (Mode) 가장 빈도가 많은 데이터 값을 특히 질적 데이터에서는 최빈값을 대표값로 정한다. ◆ 범위 (Range) 변량의 데이터의 변화폭을 말하며, 즉 최대값과 최소값의 차이를 의미한다. ◆ 편차 (Deviation) 데이터 (혹은 변량)가 평균값으로 부터 어느 정도 큰가 또는 작은가를 나타내는 값 편차 = 데이터의 값 (변량) - 평균값 ◆ 확률 (Probability) 사건이 발생할 가능성을 0과 1 사이의 값으로 표현한 것. ◆ 확률변수 (Random Variable) 표본공간의 사건을 숫자로 바꿔 주는 함수이다. 확률변수에는 주사위의 눈과 같이 비연속 데이터를 취하는 이산형 확률변수와 체중, 키와 같이 연속하는 데이터를 취하는 연속형 확률변수라 한다.
◆ 확률분포 (Probability Distribution) 확률변수와 그에 대응하는 확률을 부여하며, 확률변수는 그 확률분포에 따른다고 말하며 이를 표로 나타낸 것을 확률분포표 라고 한다. ◆ 확률밀도함수 (Probability Density Function) 연속형 확률변수가 주어진 어떤 구간 내에 포함될 확률을 확률밀도라고 하며, 이를 함수 형태롤 나타낸 것을 확률밀도함수라고 한다. ◆ 표본공간 (Sample Space) 확률적 실험을 통해 일어날 수 있는 모든 가능한 결과의 집합 ◆ 크로스 집계표 동시에 조사한 2개의 항목에 대해 해당수를 표에 정리한 표로, 분할표라고도 한다. ◆ 산포도 (Scatter Diagram) 크로스 집계표를 그래프로 나타낸 것으로 상관도 라고도 하며, 데이터에서 2개 항목 간 의 관계(이변량의 관계)를 아는데 편리하다. ◆ 상관관계 (Coefficient Correlation) 두 변량 중 하나가 증가함에 따라 다른 한 쪽이 증가 또는 감소할 때 두 변량의 관계를 의미한다. 한 변량이 증가할 때 상대 변량이 증가하면 양의 상관관계, 한 변량이 증가할 때 상대 변량이 감소하면 음의 상관관계라 한다. ◆ 공분산 (Covariance) 두 변량의 상관관계를 수치화한 것 ◆ 사건 (Event) 표본공간의 부분집합 ◆ 분산 (Variance) 확률분포 또는 자료가 얼마나 퍼져 있는지를 알려주는 수치이다. 분산은 음의 값을 가질 수 없으며 분산이 클수록 확률분포는 평균에서 멀리 퍼져있고 0에 가까울수록 평균에 집중된다. ◆ 표준편차 (Standard Deviation) 데이터가 평균을 중심으로 얼마나 퍼져있는지를 나타내는 수치로, 표준편차가 0에 가까울수록 데이터는 평균 근처에 집중되어 있음을 의미하고, 표준편차가 클수록 데이터가 널리 퍼져있음을 의미한다. 모집단 전체의 표준편차를 구할 수 없을 때, 표본의 표준편차를 이용한다. 표본표준편차는 일반적으로 s 또는 S로 나타내며 표본표준편차와 구분하여 모집단의 표준편차는 모표준편차 라고 한다. ◆ 기대값 (Expeted Value) 확률분포의 집중화 경향을 나타내는 것으로, 확률변수가 취할 수 있는 모든 값들의 평균을 의미한다. ◆ 확률밀도함수 (Probability Density Function) 연속확률변수가 어떤 구간내에 포함될 확률을 확률밀도라 하며, 이를 함수로 나타낸 것을 확률밀도함수라 한다. ◆ 정규분포 (Normal distribution)
◆ 변량의 표준화
◆ 이항분포 (Binomial distribution) 연속된 n번의 독립적 시행에서 각 시행이 확률 p를 가질 때의 이산확률분포이다. 이러한 시행 은 베르누이 시행이라고 불리기도 한다. 사실 n=1일 떄 이항분포는 베르누이 분포이다.
◆ 추정량 (Estimator) 표본정보에 의존하는 확률변수로서 모수를 추정하는 데 사용되는 표본통계량(표본평균, 표본분산, 표본비율)을 의미한다.
◆ 추정치 (Estimate) 추정량으로부터 결정되는 특정한 값을 의미한다. ◆ 불편추정량(Unbiased Estimator) 일반적으로 추정량은불편성, 일치성, 효율성 등의 특성을 가져야 하며, 불편성은 모든 가능한 통계량값의 평균이 모수와 같아지는 것이며, 이러한 통계량을 불편추정량 이라 한다. ◆ 통계적 추정(Statistical Estimation) 표본의 성격을 나타내는 통계량을 기초로 모수를 추정하는 통계적 분석 방법 ◆ 가설(Hypothesis) 검정할 목적으로 설정하는 모수에 대한 잠정적인 주장 또는 가정을 의미한다. ◆ 가설검정 (Hypothesis Test) 가설검정은 모집단에 대하여 어떤 가설을 설정하고 그 모집단으로부터 표본을 분석함으로서 그 가설의 타당성 여부를 결정하는 것이다. 이에 반하여 추정(Estimation)은 표본으로부터 계산한 통계량을 가지고 무엇이 모수 인가를 규명하는 것이다. ◆ 통계적 가설검정 (Statistical Hypothesis Test) 표본에서 얻은 사실을 근거로 모집단에 대한 가설이 맞는지 틀리는지 검정하는 통계적 분석을 통계적 가설검정(Statistical Hypothesis Test)라고 한다. ◆ 회귀분석 (Regression Analysis) 변수와 변수 사이의 관계를 규명하는 통계적 방법으로 한 변수가 다른 변수에 미치는 영향력의 크기를 알아보는 것이 회귀분석의 목적이다.


 statistics.hwp


