redness = max(0, red - (blue + green) / 2);
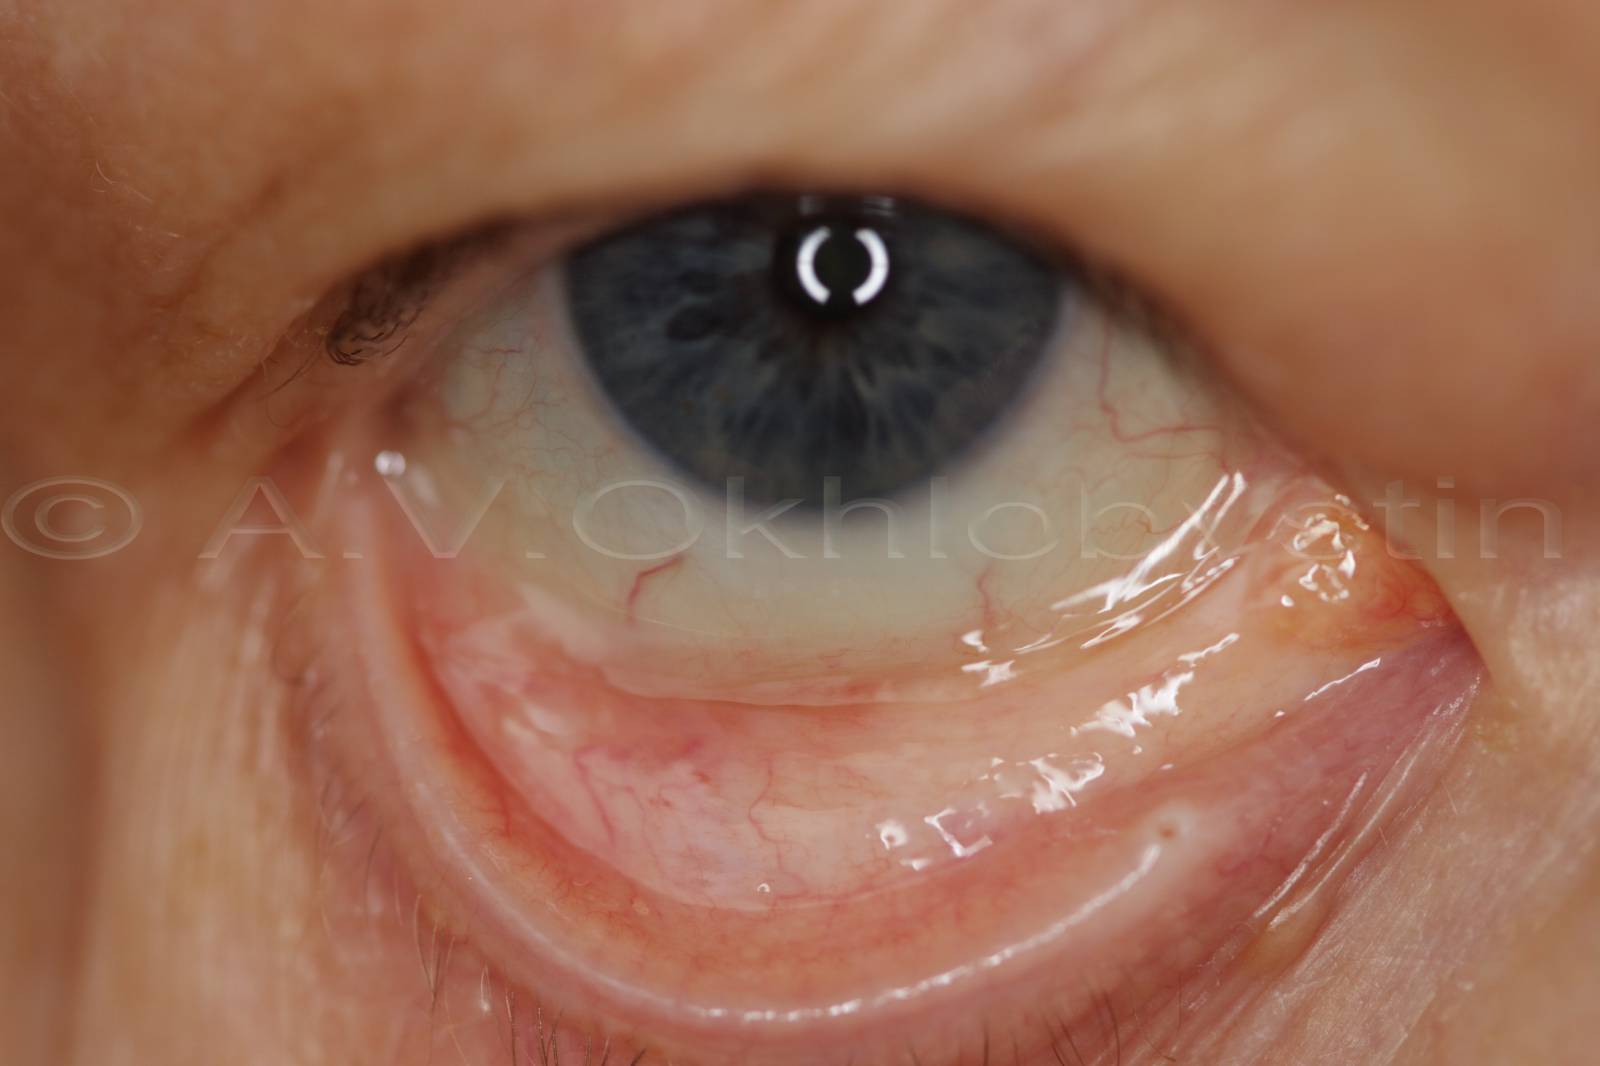
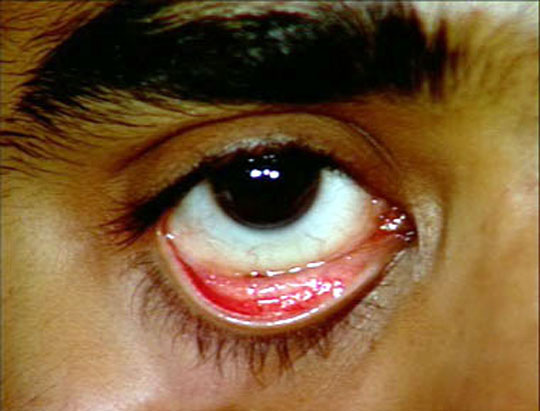
I want to identify redness in the image and then compare that value with the redness in another image. I am quite new to Matlab and don't have image processing knowledge. However, I have been trying some random techniques to do this. Till now, I have used histograms of RGB channels of individual images and have also compared average numeric values of RGB channels in individual images. Unfortunately, I see almost similar results in both cases and cannot identify difference between less red and more red image.
I randomly tried working with grayscale histograms as well but found it to be useless.


P.S. I searched on this forum and tried to find a similar problem but i did not find anything that could help me. What I need is: a. Which technique could be used to check redness in images? b. How Matlab can me help there?
%-------------------------------------------
%For histograms of all 3 RGB channels in an image

i = imread('<Path>\a7.png');
imgr = i(:,:,1);
imgg = i(:,:,2);
imgb = i(:,:,3);
histr = hist(imgr(:), bins);
histg = hist(imgg(:), bins);
histb = hist(imgb(:), bins);
hfinal = [histr(:); histg(:); histb(:)];
plot(bins, histr);


%-------------------------------------------
%To compare mean values of R channels of all images

clear all;
%read all images in a sequence
flist=dir('<Path>\*.png');

for p = 1:length(flist)
    for q = 1 : 3
    fread = strcat('<Path>\',flist(p).name);
    im = imread(fread);
    meanim(p,q) = mean2(im(:,:,q));
    end
end

%disp(meanim);
rm = meanim(:,1);
frm = sum(rm(:));
gm = meanim(:,2);
fgm = sum(gm(:));
bm = meanim(:,3);
fbm = sum(bm(:));

figure();
set(0,'DefaultAxesColorOrder',[1 0 0;0 1 0;0 0 1]);
pall = [rm(:), gm(:), bm(:)];
plot(pall);
title('Mean values of R, G and B in 12 images');
leg1 = legend('Red','Green','Blue', ...
                'Location','Best');
print (gcf, '-dbmp', 'rgbchannels.bmp')

sm = sum(meanim);
fsum = sum(sm(:));

% disp(fsum);

f2 = figure(2);
set(f2, 'Name','Average Values');
t = uitable('Parent', f2, 'Position', [20 20 520 380]);
set(t, 'ColumnName', {'Average R', 'Average G', 'Average B'});
set(t, 'Data', pall);
print (gcf, '-dbmp', 'rgbtable.bmp') ;

rgbratio = rm ./ fsum;
disp(rgbratio);

f3 = figure(3);
aind = 1:6;
hold on;
subplot(1,2,1);
plot(rgbratio(aind),'r+');
title('Plot of anemic images - having more pallor');

nind = 7:12;
subplot(1,2,2);
plot(rgbratio(nind),'b.');
title('Plot of non anemic images - having less pallor');
hold off;
print (gcf, '-dbmp', 'anemicpics
------------------------------------------------------------------------------------------------------
You can't assume the red channel is the same as the redness of a pixel by itself. A good estimate of redness of a pixel may be achieved by something like this:
redness = max(0, red - (blue + green) / 2);Where red, green and blue are values of different RGB channels in the image. Once you calculated this value for an image, you can estimate the redness of the image by some approaches like averaging or histograms.
'Digital Image Processing' 카테고리의 다른 글
| Using a Gray-Level Co-Occurrence Matrix (GLCM) (0) | 2017.02.03 |
|---|---|
| Embossing filter (0) | 2017.01.13 |
| Taking partial derivatives is easy in Matlab (0) | 2016.12.01 |
| Matlab Image Processing (0) | 2016.12.01 |
| Gabor Filter 이해하기 (0) | 2016.10.17 |


