'분류 전체보기'에 해당되는 글 1027건

  1. 2017.03.17 Convolutional Neural Networks (CNNs): An Illustrated Explanation
  2. 2017.03.16 Machine Learning/Neural Networks recommended courses
  3. 2017.03.16 linear algebra start video lectures
  4. 2017.03.13 Winning Tips on Machine Learning Competitions by Kazanova, Current Kaggle #3 | HackerEarth Blog
  5. 2017.03.13 A simple C++ project for applying filters to raw images via command line. http://www.albertodebortoli.it
  6. 2017.03.12 random forest using matlab
  7. 2017.03.11 matlab TreeBagger 예제 나와있는 페이지
  8. 2017.03.11 MATLAB Treebagger and Random Forests
  9. 2017.03.11 Tune Random Forest Using Quantile Error and Bayesian Optimization
  10. 2017.03.11 matlab fitcnb( naive Bayes model) parameter tuning방법
  11. 2017.03.11 Directory of tutorials and open-source code repositories for working with Keras, the Python deep learning library
  12. 2017.03.09 [NIPS 2016 tutorial - Summary] Nuts and bolts of building AI applications using Deep Learning 1
  13. 2017.03.09 Linear algebra cheat sheet for deep learning
  14. 2017.03.09 Android에서 TensorFlow 실행하기
  15. 2017.03.09 [머신러닝] 19. 머신러닝 학습 방법(part 14) - AutoEncoder(6) : 네이버 블로그
  16. 2017.03.09 Neural networks and deep learning
  17. 2017.03.09 matlab fitglm function parameter tuning references
  18. 2017.03.08 Difference between 'link function' and 'canonical link function' for GLM
  19. 2017.03.08 Generalized Linear Model 맛만 보기(Logistic regression analysis의 예로)
  20. 2017.03.08 5 algorithms to train a neural network
  21. 2017.03.08 An Interactive Tutorial on Numerical Optimization
  22. 2017.03.07 matlab feval VS predict
  23. 2017.03.07 MATLAB's glmfit vs fitglm , difference
  24. 2017.03.07 Is there any function to calculate Precision and Recall using Matlab?
  25. 2017.03.07 Some Matlab Code
  26. 2017.03.07 빅 데이터(기계학습/패턴분석)의 수학적 이해를 위한 책들
  27. 2017.03.06 배치파일에서 날짜 시간 따오기 batch file
  28. 2017.03.05 Here are 13 books on Machine Learning and Data Mining
  29. 2017.03.04 matlab에서 SVM으로 ROC curve 그릴 때 필요한 score(posterior probability)를 구하는 방법
  30. 2017.03.01 ssl verification error ssl certificate_verify_failed

http://xrds.acm.org/blog/2016/06/convolutional-neural-networks-cnns-illustrated-explanation/


Convolutional Neural Networks (CNNs): An Illustrated Explanation

Artificial Neural Networks (ANNs) are used everyday for tackling a broad spectrum of prediction and classification problems, and for scaling up applications which would otherwise require intractable amounts of data. ML has been witnessing a “Neural Revolution”1 since the mid 2000s, as ANNs found application in tools and technologies such as search engines, automatic translation, or video classification. Though structurally diverse, Convolutional Neural Networks (CNNs) stand out for their ubiquity of use, expanding the ANN domain of applicability from feature vectors to variable-length inputs.


The aim of this article is to give a detailed description of the inner workings of CNNs, and an account of the their recent merits and trends.
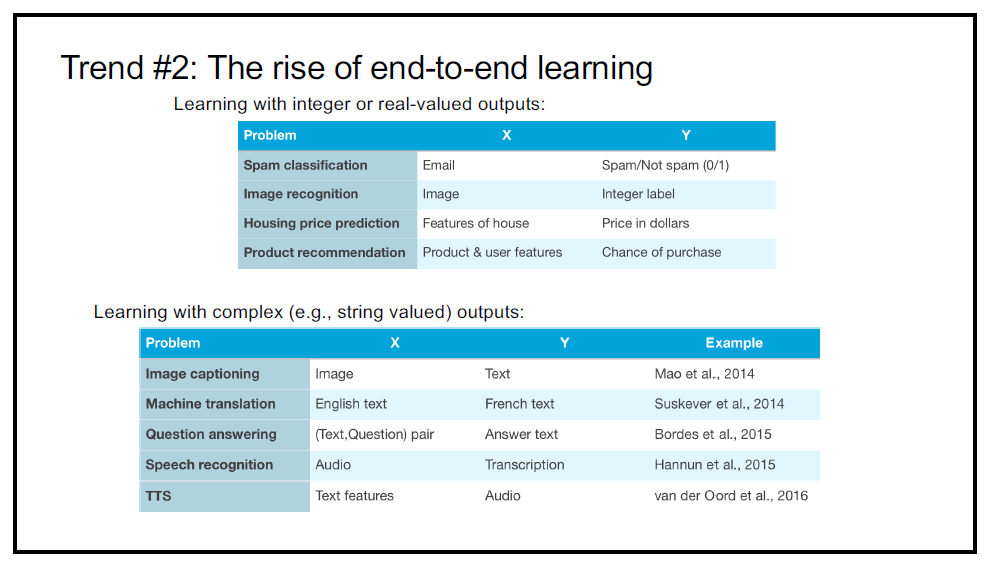
Table of Contents:

  1. Background
  2. Motivation
  3. CNN Concepts
    • Input/Output Volumes
    • Features
    • Filters (Convolution Kernels)
      • Kernel Operations Detailed
    • Receptive Field
    • Zero-Padding
    • Hyperparameters
  4. The CNN Architecture
    • Convolutional Layer
    • The ReLu (Rectified Linear Unit) Layer
    • The Fully Connected Layer
  5. CNN Design Principles
  6. Conclusion
  7. References

 1The Neural Revolution is a reference to the period beginning 1982, when academic interest in the field of Neural Networks was invigorated by CalTech professor John J. Hopfield, who authored a research paper[1] that detailed the neural network architecture named after himself. The crucial breakthrough, however, occurred  in 1986, when the backpropagation algorithm was proposed as such by David Rumelhart, Geoffrey E. Hinton and R.J. Williams [2]. For a history of neural networks, please see Andrey Kurenkov’s blog [3].


Acknowledgement

I would like to thank Adrian Scoica and Pedro Lopez for their immense patience and help with writing this piece. The sincerity of efforts and guidance that they’ve provided is ineffable. I’m forever inspired.

Background

The modern Convolutional Neural Networks owe their inception to a well-known 1998 research paper[4] by Yann LeCun and Léon Bottou. In this highly instructional and detailed paper, the authors propose a neural architecture called LeNet 5 used for recognizing hand-written digits and words that established a new state of the art2 classification accuracy of 99.2% on the MNIST dataset[5].

According to the author’s accounts, CNNs are biologically-inspired models. The research investigations carried out by D. H. Hubel and T. N. Wiesel in their paper[6] proposed an explanation for the way in which mammals visually perceive the world around them using a layered architecture of neurons in the brain, and this in turn inspired engineers to attempt to develop similar pattern recognition mechanisms in computer vision.
The most popular application for CNNs in the recent times has been Image Analysis, but many researchers have also found other interesting and exciting ways to use them: from winning Go matches against human players([7], a related video [8]) to an innovative application in discovering new drugs by training over large quantities of molecular structure data of organic compounds[9].

Motivation

A first question to answer with CNNs is why are they called Convolutional in the first place.

Convolution is a mathematical concept used heavily in Digital Signal Processing when dealing with signals that take the form of a time series. In lay terms, convolution is a mechanism to combine or “blend”[10] two functions of time3 in a coherent manner. It can be mathematically described as follows:

For a discrete domain of one variable:

CodeCogsEqn (1)

For a discrete domain of two variables:

CodeCogsEqn (2)


2A point to note here is the improvement is, in fact, modest. Classification accuracies greater than or equal to 99% on MNIST have been achieved using non-neural methods as well, such as K-Nearest Neighbours (KNN) or Support Vector Machines (SVM). For a list of ML methods applied and the respective classification accuracies attained, please refer to this[11] table.

3Or, for that matter, of another parameter.


Eq. 2 is perhaps more descriptive of what convolution truly is: a summation of pointwise products of function values, subject to traversal.

Though conventionally called as such, the operation performed on image inputs with CNNs is not strictly convolution, but rather a slightly modified variant called cross-correlation[10], in which one of the inputs is time-reversed:

2016-06-29 22_48_55-CNN_Blogpost_ - Google Docs

CNN Concepts

CNNs have an associated terminology and a set of concepts that is unique to them, and that sets them apart from other types of neural network architectures. The main ones are explained as follows:

Input/Output Volumes

CNNs are usually applied to image data. Every image is a matrix of pixel values. The range of values that can be encoded in each pixel depends upon its bit size. Most commonly, we have 8 bit or 1 Byte-sized pixels. Thus the possible range of values a single pixel can represent is [0, 255]. However, with coloured images, particularly RGB (Red, Green, Blue)-based images, the presence of separate colour channels (3 in the case of RGB images) introduces an additional ‘depth’ field to the data, making the input 3-dimensional. Hence, for a given RGB image of size, say 255×255 (Width x Height) pixels, we’ll have 3 matrices associated with each image, one for each of the colour channels. Thus the image in it’s entirety, constitutes a 3-dimensional structure called the Input Volume (255x255x3).

Figure 1: The cross-section of an input volume of size: 4 x 4 x 3. It comprises of the 3 Colour channel matrices of the input image.

Features

Just as its literal meaning implies, a feature is a distinct and useful observation or pattern obtained from the input data that aids in performing the desired image analysis. The CNN learns the features from the input images. Typically, they emerge repeatedly from the data to gain prominence. As an example, when performing Face Detection, the fact that every human face has a pair of eyes will be treated as a feature by the system, that will be detected and learned by the distinct layers. In generic object classification, the edge contours of the objects serve as the features.

Filters (Convolution Kernels)

A filter (or kernel) is an integral component of the layered architecture.

Generally, it refers to an operator applied to the entirety of the image such that it transforms the information encoded in the pixels. In practice, however, a kernel is a smaller-sized matrix in comparison to the input dimensions of the image, that consists of real valued entries.

The kernels are then convolved with the input volume to obtain so-called ‘activation maps’. Activation maps indicate ‘activated’ regions, i.e. regions where features specific to the kernel have been detected in the input. The real values of the kernel matrix change with each learning iteration over the training set, indicating that the network is learning to identify which regions are of significance for extracting features from the data.

Kernel Operations Detailed

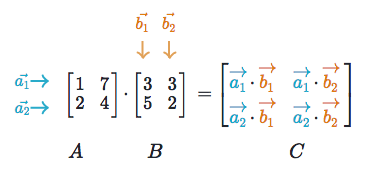
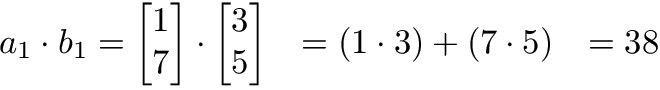
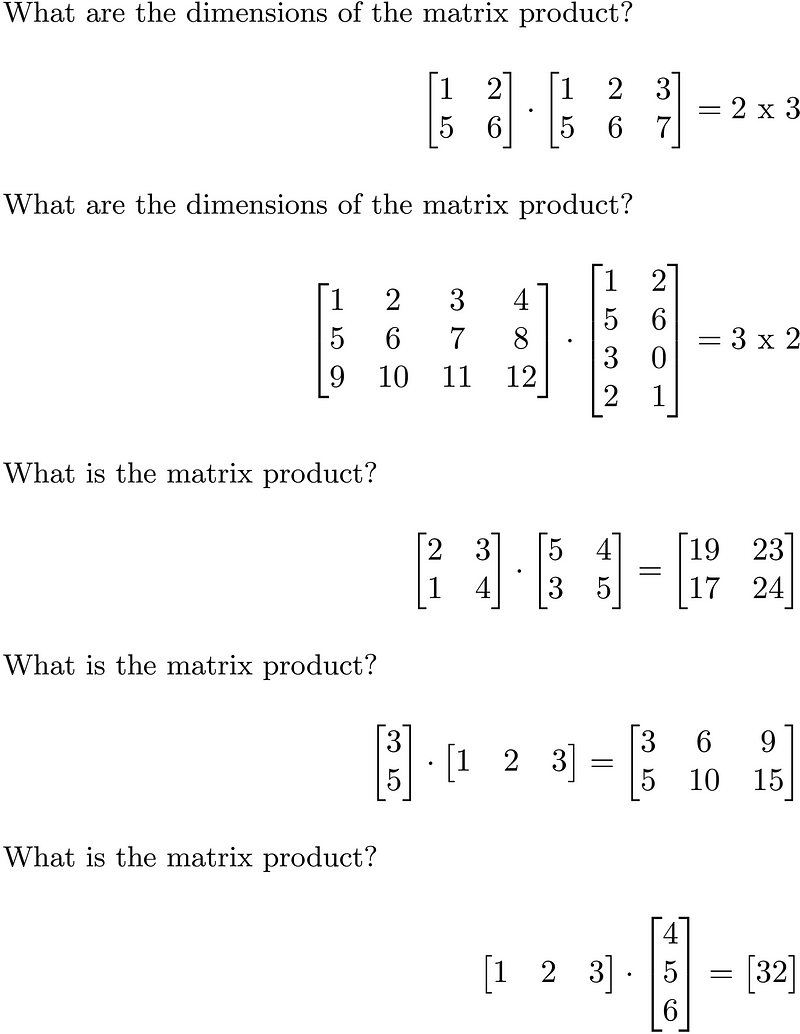
The exact procedure for convolving a Kernel (say, of size 16 x 16) with the input volume (a 256 x 256 x 3 sized RGB image in our case) involves taking patches from the input image of size equal to that of the kernel (16 x 16), and convolving (or calculating the dot product) between the values in the patch and those in the kernel matrix.

The convolved value obtained by summing the resultant terms from the dot product forms a single entry in the activation matrix. The patch selection is then slided (towards the right, or downwards when the boundary of the matrix is reached) by a certain amount called the ‘stride’ value, and the process is repeated till the entire input image has been processed. The process is carried out for all colour channels. For normalization purposes, we divide the calculated value of the activation matrix by the sum of values in the kernel matrix.

The process is demonstrated in Figure 2, using a toy example consisting of a 3-channel 4×4-pixels input image and a 3×3 kernel matrix.  Note that:

  • pixels are numbered from 1 in the example;
  • the values in the activation map are normalized to ensure the same intensity range between the input volume and the output volume. Hence, for normalization, we divide the calculated value for the ‘red’ channel by 2 (the sum of values in the kernel matrix);
  • we assume the same kernel matrix for all the three channels, but it is possible to have a separate kernel matrix for each colour channel;
  • for a more detailed and intuitive explanation of the convolution operation, you can refer to the excellent blog-posts by Chris Olah[12] and by Tim Dettmers[13].

Figure_2

Figure 2: The convolution value is calculated by taking the dot product of the corresponding values in the Kernel and the channel matrices. The current path is indicated by the red-coloured, bold outline in the Input Image volume. Here, the entry in the activation matrix is calculated as:

CodeCogsEqn (6)

Receptive Field

It is impractical to connect all neurons with all possible regions of the input volume. It would lead to too many weights to train, and produce too high a computational complexity. Thus, instead of connecting each neuron to all possible pixels, we specify a 2 dimensional region called the ‘receptive field[14]’ (say of size 5×5 units) extending to the entire depth of the input (5x5x3 for a 3 colour channel input), within which the encompassed pixels are fully connected to the neural network’s input layer. It’s over these small regions that the network layer cross-sections (each consisting of several neurons (called ‘depth columns’)) operate and produce the activation map.

Zero-Padding

Zero-padding refers to the process of symmetrically adding zeroes to the input matrix. It’s a commonly used modification that allows the size of the input to be adjusted to our requirement. It is mostly used in designing the CNN layers when the dimensions of the input volume need to be preserved in the output volume.

Figure_3

Figure 3: A zero-padded 4 x 4 matrix becomes a 6 x 6 matrix.

Hyperparameters

In CNNs, the properties pertaining to the structure of layers and neurons, such spatial arrangement and receptive field values, are called hyperparameters. Hyperparameters uniquely specify layers. The main CNN hyperparameters are receptive field (R), zero-padding (P), the input volume dimensions (Width x Height x Depth, or W x H x D ) and stride length (S).

The CNN Architecture

Now that we are familiar with the CNN terminology, let’s go on ahead and study the CNN architecture in detail.

The architecture of a typical CNN is composed of multiple layers where each layer performs a specific function of transforming its input into a useful representation. There are 3 major types of layers that are commonly observed in complex neural network architectures:

Convolutional Layer
Also referred to as Conv. layer, it forms the basis of the CNN and performs the core operations of training and consequently firing the neurons of the network. It performs the convolution operation over the input volume as specified in the previous section, and consists of a 3-dimensional arrangement of neurons (a stack of 2-dimensional layers of neurons, one for each channel depth).

Figure_4

Figure 4: A 3-D representation of the Convolutional layer with 3 x 3 x 4 = 36 neurons.

Each neuron is connected to a certain region of the input volume called the receptive field (explained in the previous section). For example, for an input image of dimensions 28x28x3, if the receptive field is 5 x 5, then each neuron in the Conv. layer is connected to a region of 5x5x3 (the region always comprises the entire depth of the input, i.e. all the channel matrices) in the input volume. Hence each neuron will have 75 weighted inputs. For a particular value of R (receptive field), we have a cross-section of neurons entirely dedicated to taking inputs from this region. Such a cross-section is called a ‘depth column’. It extends to the entire depth of the Conv. layer.

For optimized Conv. layer implementations, we may use a Shared Weights model that reduces the number of unique weights to train and consequently the matrix calculations to be performed per layer. In this model, each ‘depth slice’ or a single 2-dimensional layer of neurons in the Conv architecture all share the same weights. The caveat with parameter sharing is that it doesn’t work well with images that encompass a spatially centered structure (such as face images), and in applications where we want the distinct features of the image to be detected in spatially different locations of the layer.

Figure_5

Figure 5: Concept of Receptive Field.

We must keep in mind though that the network operates in the same way that a feed-forward network would: the weights in the Conv layers are trained and updated in each learning iteration using a Back-propagation algorithm extended to be applicable to 3-dimensional arrangements of neurons.

The ReLu (Rectified Linear Unit) Layer

ReLu refers to the Rectifier Unit, the most commonly deployed activation function for the outputs of the CNN neurons. Mathematically, it’s described as:

CodeCogsEqn (3)

Unfortunately, the ReLu function is not differentiable at the origin, which makes it hard to use with backpropagation training. Instead, a smoothed version called the Softplus function is used in practice:

CodeCogsEqn (4)

The derivative of the softplus function is the sigmoid function, as mentioned in a prior blog post.

CodeCogsEqn (5)

The Pooling Layer

The pooling layer is usually placed after the Convolutional layer. Its primary utility lies in reducing the spatial dimensions (Width x Height) of the Input Volume for the next Convolutional Layer. It does not affect the depth dimension of the Volume.  

The operation performed by this layer is also called ‘down-sampling’, as the reduction of size leads to loss of information as well. However, such a loss is beneficial for the network for two reasons:

  1. the decrease in size leads to less computational overhead for the upcoming layers of the network;
  2. it work against over-fitting.

Much like the convolution operation performed above, the pooling layer takes a sliding window or a certain region that is moved in stride across the input transforming the values into representative values. The transformation is either performed by taking the maximum value from the values observable in the window (called ‘max pooling’), or by taking the average of the values. Max pooling has been favoured over others due to its better performance characteristics.

The operation is performed for each depth slice. For example, if the input is a volume of size 4x4x3, and the sliding window is of size 2×2, then for each color channel, the values will be down-sampled to their representative maximum value if we perform the max pooling operation.

No new parameters are introduced in the matrix by this operation. The operation can be thought of as applying a function over input values, taking fixed sized portions at a time, with the size, modifiable as a parameter. Pooling is optional in CNNs, and many architectures do not perform pooling operations.

Figure_6

Figure 6: The Max-Pooling operation can be observed in sub-figures (i), (ii) and (iii) that max-pools the 3 colour channels for an example input volume for the pooling layer. The operation uses a stride value of [2, 2]. The dark and red boundary regions describe the window movement. Sub-figure (iv) shows the operation applied for a stride value of [1,1], resulting in a 3×3 matrix Here we observe overlap between regions.

The Fully Connected Layer

The Fully Connected layer is configured exactly the way its name implies: it is fully connected with the output of the previous layer. Fully-connected layers are typically used in the last stages of the CNN to connect to the output layer and construct the desired number of outputs.

CNN Design Principles

Given the aforementioned building blocks, the last detail before implementing a CNN is to specify its design end to end, and to decide on the layer dimensions of the Convolutional layers.

A quick and dirty empirical formula[15] for calculating the spatial dimensions of the Convolutional Layer as a function of the input volume size and the hyperparameters we discussed before can be written as follows:

For each (ith) dimension of the input volume, pick:

Eq_7

where is the (ith) input dimension, R is the receptive field value, P is the padding value, and S is the value of the stride. Note that the formula does not rely on the depth of the input.

To better understand better how it works, let’s consider the following example:

  1. Let the dimensions of the input volume be 288x288x3, the stride value be 2 (both along horizontal and vertical directions).
  2. Now, since WIn=288 and S = 2, (2.P – R) must be an even integer for the calculated value to be an integer. If we set the padding to 0 and R = 4, we get WOut=(288-4+2.0)/2+1 =284/2 + 1 = 143. As the spatial dimensions are symmetrical (same value for width and height), the output dimensions are going to be: 143 x 143 x K, where K is the depth of the layer. K can be set to any value, with increasing values for every Conv. layer added. For larger networks values of 512 are common.
  3. The output volume from a Conv. layer either has the same dimensions as that of the Conv. layer (143x143x2 for the example considered above), or the same as that of the input volume (288x288x3 for the example above).

The generic arrangement of layers can thus be summarized as follows[15]:

Eq_8

Where N usually takes values between 0 and 3, M >= 0 and K∈[0,3).

The expression indicates multiple layers, with or without per layer-Pooling. The final layer is the fully-connected output layer. See [8] for more case-studies of CNN architectures, as well as a detailed discussion of layers and hyper-parameters.  

Conclusion

CNNs showcase the awesome levels of control over performance that can be achieved by making effective use of theoretical and mathematical insights. Many real world problems are being efficiently tackled using CNNs, and MNIST represents a simple, “Hello World”-type use-case of this technique. More complex problems such as object and image recognition require the use of deep neural networks with millions of parameters to obtain state-of-the-art results. CIFAR-10 is a good problem to solve in this domain, and it was first solved by Alex Krizhevsky et al.[16] in 2009. You can read through the technical report and try and grasp the approach before making way to the TensorFlow tutorial that solves the same problem[17].

Furthermore, applications are not limited to computer vision. The most recent win of Google’s AlphaGo Project over Lee Sedol in the Go game series relied on a CNN at its core. The self-driving cars which, in the coming years, will arguably become a regular sight on our streets, rely on CNNs for steering[18]. Google even held an art-show[19] for imagery created by its DeepDream project that showcased beautiful works of art created by visualizing the transformations of the network!

Thus a Machine Learning researcher or engineer in today’s world can rejoice at the technological melange of techniques at her disposal, among which an in-depth understanding of CNNs is both indispensable and empowering.


References

[1] Hopfield, John J. “Neural networks and physical systems with emergent collective computational abilities.” Proceedings of the national academy of sciences 79.8 (1982): 2554-2558.[http://www.pnas.org/content/79/8/2554.abstract]

[2]  Rumelhart, D. E., Hinton, G. E., and Williams, R. J. (1986). Learning representations by back-propagating errors. Nature, 323, 533–536.[http://www.iro.umontreal.ca/~vincentp/ift3395/lectures/backprop_old.pdf]

[3]   Andrey Kurenkov, “A brief History of Neural Nets and Deep Learning”.[http://www.andreykurenkov.com/writing/a-brief-history-of-neural-nets-and-deep-learning/]

[4]  LeCun, Yann, et al. “Gradient-based learning applied to document recognition.” Proceedings of the IEEE 86.11 (1998): 2278-2324.

[5] The MNIST database of handwritten digits

[6] Hubel, David H., and Torsten N. Wiesel. “Receptive fields and functional architecture of monkey striate cortex.” The Journal of physiology 195.1 (1968): 215-243.

[7] Alpha Go video by Nature.                                             [http://www.nature.com/news/google-ai-algorithm-masters-ancient-game-of-go-1.19234]

[8] Clark, Christopher, and Amos Storkey. “Teaching deep convolutional neural networks to play go.” arXiv preprint arXiv:1412.3409 (2014).[http://arxiv.org/pdf/1412.3409.pdf]

[9] Wallach, Izhar, Michael Dzamba, and Abraham Heifets. “AtomNet: A Deep Convolutional Neural Network for Bioactivity Prediction in Structure-based Drug Discovery.” arXiv preprint arXiv:1510.02855 (2015).

[http://arxiv.org/pdf/1510.02855.pdf]

[10] Weisstein, Eric W. “Convolution.” From MathWorld — A Wolfram Web Resource. [http://mathworld.wolfram.com/Convolution.html]

[11] Table of classification accuracies attained over MNIST. [https://en.wikipedia.org/wiki/MNIST_database#Performance]

[12] Chris Olah, “Understanding Convolutions”.                           [http://colah.github.io/posts/2014-07-Understanding-Convolutions/]

[13] Tim Dettmers, “Understanding Convolution In Deep Learning”.[http://timdettmers.com/2015/03/26/convolution-deep-learning/]

[14] TensorFlow Documentation: Convolution [https://www.tensorflow.org/versions/r0.7/api_docs/python/nn.html#convolution]

[15] Andrej Karpathy, “CS231n: Convolutional Neural Networks for Visual Recognition” [http://cs231n.github.io/convolutional-networks/]

[16] Krizhevsky, Alex, and Geoffrey Hinton. “Learning multiple layers of features from tiny images.” (2009).[http://www.cs.toronto.edu/~kriz/learning-features-2009-TR.pdf]

[17] TensorFlow: Convolutional Networks.[https://www.tensorflow.org/versions/r0.7/tutorials/deep_cnn/index.html#cifar-10-model]

[18] Google Deepmind’s AlphaGo: How it works.       [https://www.tastehit.com/blog/google-deepmind-alphago-how-it-works/]

[19] An Empirical Evaluation of Deep Learning on Highway Driving.[http://arxiv.org/pdf/1504.01716.pdf]

[20] Inside Google’s First DeepDream Art Project. [http://www.fastcodesign.com/3057368/inside-googles-first-deepdream-art-show/11]


Posted by uniqueone
,

Facebook, Data Mining / Machine Learning / AI

I'm a programmer and I'm serious about learning Machine Learning/Neural Networks. Issue is that I have no idea where to start. Anyone can suggest maybe a certain course or generally a place to start from?

----------------------------------------------------

1. Andrew NG's Machine Learning course in Coursera

https://www.coursera.org/learn/machine-learning

2. Essence of linear algebra preview

https://www.youtube.com/watch?v=kjBOesZCoqc&list=PLZHQObOWTQDPD3MizzM2xVFitgF8hE_ab

3. 7 Steps to Mastering Machine Learning With Python

http://www.kdnuggets.com/2015/11/seven-steps-machine-learning-python.html/2

4. youtube sirajology

https://www.youtube.com/channel/UCWN3xxRkmTPmbKwht9FuE5A

5. Michael Nielsen

http://neuralnetworksanddeeplearning.com/chap1.html

6. https://bigdatauniversity.com/


7. udacity Deep Learning Fundations


8. Udemy Course by Kirill and hadelen if you are extremely new to data science.

superdatascience.com

9. Geoffrey Hinton's neural net course on coursera


10. welch labs Neural Networks Demystified

https://www.youtube.com/watch?v=bxe2T-V8XRs&list=PLiaHhY2iBX9hdHaRr6b7XevZtgZRa1PoU

11. 초보자를 위한 조언 및 사이트 소개

https://vmanju.com/how-to-get-started-with-artificial-intelligence-90f14b2bc321#.k4vef6fd3

caffe를 어떻게 설치하고 어떻게 동작하는지 설명돼 있음.

https://github.com/humphd/have-fun-with-machine-learning/blob/master/README.md


12. An Introduction to Statistical Learning with Applications in R

http://www-bcf.usc.edu/~gareth/ISL/


Posted by uniqueone
,
If you haven't taken linear algebra start here: https://www.youtube.com/watch?v=kjBOesZCoqc&list=PLZHQObOWTQDPD3MizzM2xVFitgF8hE_ab

Then go on to Udacity's free Tensorflow course. Keep in mind that neural nets are one of many ML techniques.
Posted by uniqueone
,

Winning Tips on Machine Learning Competitions by Kazanova, Current Kaggle #3 | HackerEarth Blog
http://blog.hackerearth.com/winning-tips-machine-learning-competitions-kazanova-current-kaggle-3
Posted by uniqueone
,
https://github.com/albertodebortoli/ImageAnalysisFilters

Image Analysis Filters

A simple C++ project for applying filters to raw images via command line.

Author: Alberto De Bortoli
Date: august 2008
Course: Elaborazione delle Immagini (Image Analysis) Università degli studi di Padova, Prof. Paolo Cattani
Website: albertodebortoli.it

Compile the project with 'make' command with g++ (tested on version 4.2.1). Executable file 'ImageFilters' is generated for your architecture.

Description and usage

Source code files in the project:

  • Main.cpp
  • Image.{h,cpp}
  • FiltersPunctual.{h,cpp}
  • FiltersConvolution.{h,cpp}
  • FiltersAdj.{h,cpp}
  • FiltersStripes.{h,cpp}
  • FT.{h,cpp}
  • FFT.{h,cpp}

The project implement the following:

  • Custom image size;
  • FT and FFT for high or low pass filter with cutoff value;
  • Implemented filters: Brightness, Auto Contrast, Gamma Correction, Gamma Correction on channels, Invert, Mirror, Pixelazer, Smooth, Noise Removal, Blur, Outliner (Emboss), Sharpen, Rotation;
  • Low pass filter without using FT.

Execution needs at least 7 command line arguments. 6 base arguments and 1 for the chosen filter to apply to the source image. First 6 base arguments are described as follow:

  1. path source image (*.raw)
  2. path immagine destinazione (*.raw)
  3. source image width
  4. source image height
  5. kind of source image ('0' for grayscale, '1' for color RGB interleaved)
  6. kind of destination image ('0' for grayscale, '1' for color RGB interleaved)

Here is an example of usage with the first 6 arguments:

./ImageFilters ./img/400x300RGB.raw ./img/output.raw 400 300 1 0

One more argument (at least) is needed for filter application. Filters can be applied sequentially. Filters description follows.

Equalize

Spread the hystogram of gray over all the range of color space.
syntax: e
example: e

Brightness

Modify the image brightness using a given value.
syntax: l <mod_value>
example: l 2.0

Automatic Contrast

Apply auto contrast filter. Spread the hystogram to use the entire range.
syntax: a
example: a

Gamma Correction

Apply Gamma Correction filter with a given value.
syntax: g <mod_value>
example: g 0.8

Channel

Apply Gamma Correction filter on a given RGB channel with a given value. Only applicable to color images.
syntax: h <mod_value> <channel>
example: h 0.8 R

Invert

Invert the colors in the image.
syntax: i
example: i

Mirror

Mirror the image. If <mod_value> is the direction ('X' for horizontally, 'Y' for vertically).
syntax: m <mod_value>
example: m X

Pixelizer

Apply the pixelize filter. <mod_value> is the size of the macro pixel in the output image.
syntax: p <mod_value>
example: p 6

Smooth

Apply smooth effect using a <kernel_dim>x<kernel_dim> kernel matrix.
syntax: s <kernel_dim>
example: s 5

Remove noise

Remove the noise using a <kernel_dim>x<kernel_dim> kernel matrix.
syntax: r <kernel_dim>
example: r 5

Sharpen - Blur - Outline

Apply a convolution filter using a 3x3 kernel matrix.< filter_type> can be:
'S' for Sharpen filter
'B' for Blur filter
'O' for Outliner (emboss filter)
syntax: c <filter_type>
example: c S

Rotation

Rotate the image of degrees.
syntax: q <rotation_angle>
example: q 45

Zoom

Zoom in or out. <zoom_flag> can be '-' for zoom in or '+' for zoom out. <mod_value> is the zoom percentage.
syntax: z <zoom_flag> <mod_value>
example: z + 30

Resize

Resize the image. Output image has width, height is proportionally derived. syntax: Z <mod_value>
example: Z 250

Grayscale

Convert a color image (RGB) to grayscale. Only applicable to grayscale images.
syntax: b
example: b

Low-Pass filter

Cuts off high frequencies. <cutoff_value> (the cut off value) and <kernel_dim> (the kernel dimension) result in a stronger or weaker filter effect.
syntax: - <cutoff_value> <kernel_dim>
example: - 15 5

Fourier Transform

Two kind of Fourier Transform can be used: FT and FFT. They are used for frequency filtering (low-pass/high-pass filter). Classic FT runs in N^2, FFT runs in N log N.

syntax: <FT_type> <filter_type> <cutoff_value> <filtering_type>
example: f l 30 I

<FT_type> is for FT ('f') or for FFT ('F').
< filter_type> can be 'l' o 'h' based on low or high filter application.
< cutoff_value> is the cutoff value.
< filtering_type> is for ideal filtering (ILPF/IHPF) ('I') or bell shaped 'B' one.

Application of filter automatically saves spectrum in ‘magnitude.raw’ file for later access.

Here are example of usage of FT. Source image is 128x128 grayscale.

Original image
Original image

Transform spectrum
Transform spectrum

Here are the spectrums and the image as result of filter application.
Low-pass filter, ideal, threshold = 30
syntax: ./ImageFilters ./img/128x128BN.raw ./img/output.raw 128 128 0 0 F l 30 I

Low-pass filter, bell shaped, threshold = 30
syntax: ./ImageFilters ./img/128x128BN.raw ./img/output.raw 128 128 0 0 F l 30 C

High-pass filter, ideal, threshold = 10
syntax: ./ImageFilters ./img/128x128BN.raw ./img/output.raw 128 128 0 0 F h 10 I

High-pass filter, ideal, threshold = 10
syntax: ./ImageFilters ./img/128x128BN.raw ./img/output.raw 128 128 0 0 F h 10 C

Source images need to be power of 2 size to apply FFT. If not, scaling to next power of 2 is applied filling empty spaces with 0 (black). The image is then trimmed back to original size fter FFT.

Source image 160x100

Scaled image to power of 2 size, i.e 256x128

Scaled image spectrum

Image after backward FFT

Cut image to original size 160x100

Following images show the differences between hystogram equalization of pre and post equalization.

Equalizzazione pre filtraggio
Pre filtering equalization

Equalizzazione post filtraggio
Post filtering equalization

License

Licensed under the New BSD License.

Copyright (c) 2008, Alberto De Bortoli at Università degli Studi di Padova. All rights reserved.

Redistribution and use in source and binary forms, with or without modification, are permitted provided that the following conditions are met: * Redistributions of source code must retain the above copyright notice, this list of conditions and the following disclaimer. * Redistributions in binary form must reproduce the above copyright notice, this list of conditions and the following disclaimer in the documentation and/or other materials provided with the distribution. * Neither the name of the Università degli Studi di Padova nor the names of its contributors may be used to endorse or promote products derived from this software without specific prior written permission.

THIS SOFTWARE IS PROVIDED BY Alberto De Bortoli ``AS IS'' AND ANY EXPRESS OR IMPLIED WARRANTIES, INCLUDING, BUT NOT LIMITED TO, THE IMPLIED WARRANTIES OF MERCHANTABILITY AND FITNESS FOR A PARTICULAR PURPOSE ARE DISCLAIMED. IN NO EVENT SHALL Alberto De Bortoli BE LIABLE FOR ANY DIRECT, INDIRECT, INCIDENTAL, SPECIAL, EXEMPLARY, OR CONSEQUENTIAL DAMAGES (INCLUDING, BUT NOT LIMITED TO, PROCUREMENT OF SUBSTITUTE GOODS OR SERVICES; LOSS OF USE, DATA, OR PROFITS; OR BUSINESS INTERRUPTION) HOWEVER CAUSED AND ON ANY THEORY OF LIABILITY, WHETHER IN CONTRACT, STRICT LIABILITY, OR TORT (INCLUDING NEGLIGENCE OR OTHERWISE) ARISING IN ANY WAY OUT OF THE USE OF THIS SOFTWARE, EVEN IF ADVISED OF THE POSSIBILITY OF SUCH DAMAGE.

'Digital Image Processing' 카테고리의 다른 글

17 Colors APIs  (0) 2017.07.27
Using a Gray-Level Co-Occurrence Matrix (GLCM)  (0) 2017.02.03
Embossing filter  (0) 2017.01.13
Taking partial derivatives is easy in Matlab  (0) 2016.12.01
Matlab Image Processing  (0) 2016.12.01
Posted by uniqueone
,

 https://www.kaggle.com/c/titanic/discussion/6288


Hello,


Here's a matlab code to dowload the data and try some random forests with k-fold validation. Extensive test on the numbers of trees and mtry suggest default parameters are fine and the model robust to changing these hyperparameters (including the k for k-fold).


Two questions please:

1) do you see why the performance are so different for train and test set? k-fold cross validation suggest the model should get 0.82, but on the test set it gets 0.74, which is below 0.82 minus 3 SD (computed through 30 random repetitions). Does this sound likely or would you guess it indicates a bug somewhere?


2) I'm trying to set the random generator so as to make my prediction deterministic, however something sucks. Matlab random generators seems to behave fine (namely, A=rand(3,2) produces the very same numbers again and again), but overall the model still produce random predictions. I suspect the mex files don't rely on the random generator setted by matlab. Do you see a way to deal with this issue?  


Regards,


PS:

The train.csv and test.csv are assumed to be in a folder "data", with all *.m in its parent file. In addition to the three first attached files (get_titanic... and pred.m), one need to get the mex and m file available through:

https://code.google.com/p/randomforest-matlab/downloads/list

(if your system fits mine, you can probably just take the attached files)


Posted by uniqueone
,

https://github.com/mlab-upenn/DRAdvisor


https://github.com/mlab-upenn/DRAdvisor/blob/master/Tool/GUI/Inputs.m

B = TreeBagger(num_trees,Xtrain,Ytrain,'Method','regression','OOBPred','On','OOBVarImp','on',...
'CategoricalPredictors',catcol,'MinLeaf',minleaf);


Posted by uniqueone
,

http://stackoverflow.com/questions/17549337/matlab-treebagger-and-random-forests

Does the Treebagger class in MATLAB apply Breiman's Random Forest algorithm?

If I simply use Treebagger, is it the same as using Random Forests, or do I need to modify some parameters?

Thanks.


TreeBagger implements a bagged decision tree algorithm, rather than Random Forests specifically.

You can get TreeBagger to behave basically the same as Random Forests as long as the NVarsToSample parameter is set appropriately. See the documentation page for TreeBagger, under the NVarsToSample parameter, for details.

Edit: Note that in release R2015b, the NVarsToSample parameter has been renamed to NumPredictorsToSample.


http://stats.stackexchange.com/questions/184589/random-forests-for-predictor-importance-matlab

What you describe would be one approach. For classification, TreeBagger by default randomly selects sqrt(p) predictors for each decision split (setting recommended by Breiman).


Posted by uniqueone
,


https://www.mathworks.com/help/stats/tune-random-forest-using-quantile-error-and-bayesian-optimization.html


This example shows how to implement Bayesian optimization to tune the hyperparameters of a random forest of regression trees using quantile error. Tuning a model using quantile error, rather than mean squared error, is appropriate if you plan to use the model to predict conditional quantiles rather than conditional means.

Load and Preprocess Data

Load the carsmall data set. Consider a model that predicts the median fuel economy of a car given its acceleration, number of cylinders, engine displacement, horsepower, manufacturer, model year, and weight. Consider Cylinders, Mfg, and Model_Year as categorical variables.

load carsmall
Cylinders = categorical(Cylinders);
Mfg = categorical(cellstr(Mfg));
Model_Year = categorical(Model_Year);
X = table(Acceleration,Cylinders,Displacement,Horsepower,Mfg,...
    Model_Year,Weight,MPG);
rng('default'); % For reproducibility

Specify Tuning Parameters

Consider tuning:

  • The complexity (depth) of the trees in the forest. Deep trees tend to over-fit, but shallow trees tend to underfit. Therefore, specify that the minimum number of observations per leaf be at most 20.

  • When growing the trees, the number of predictors to sample at each node. Specify sampling from 1 through all of the predictors.

bayesopt, the function that implements Bayesian optimization, requires you to pass these specifications as optimizableVariable objects.

maxMinLS = 20;
minLS = optimizableVariable('minLS',[1,maxMinLS],'Type','integer');
numPTS = optimizableVariable('numPTS',[1,size(X,2)-1],'Type','integer');
hyperparametersRF = [minLS; numPTS];

hyperparametersRF is a 2-by-1 array of OptimizableVariable objects.

You should also consider tuning the number of trees in the ensemble. bayesopt tends to choose random forests containing many trees because ensembles with more learners are more accurate. If available computation resources is a consideration, and you prefer ensembles with as fewer trees, then consider tuning the number of trees separately from the other parameters or penalizing models containing many learners.

Declare Objective Function

Declare an objective function for the Bayesian optimization algorithm to optimize. The function should:

  • Accept the parameters to tune as an input.

  • Train a random forest using TreeBagger. In the TreeBagger call, specify the parameters to tune and specify returning the out-of-bag indices.

  • Estimate the out-of-bag quantile error based on the median.

  • Return the out-of-bag quantile error.

function oobErr = oobErrRF(params,X)
%oobErrRF Trains random forest and estimates out-of-bag quantile error
%   oobErr trains a random forest of 300 regression trees using the
%   predictor data in X and the parameter specification in params, and then
%   returns the out-of-bag quantile error based on the median. X is a table
%   and params is an array of OptimizableVariable objects corresponding to
%   the minimum leaf size and number of predictors to sample at each node.
randomForest = TreeBagger(300,X,'MPG','Method','regression',...
    'OOBPrediction','on','MinLeafSize',params.minLS,...
    'NumPredictorstoSample',params.numPTS);
oobErr = oobQuantileError(randomForest);
end


Minimize Objective Using Bayesian Optimization

Find the model achieving the minimal, penalized, out-of-bag quantile error with respect to tree complexity and number of predictors to sample at each node using Bayesian optimization. Specify the expected improvement plus function as the acquisition function and suppress printing the optimization information.

results = bayesopt(@(params)oobErrRF(params,X),hyperparametersRF,...
    'AcquisitionFunctionName','expected-improvement-plus','Verbose',0);

results is a BayesianOptimization object containing, among other things, the minimum of the objective function and the optimized hyperparameter values.

Display the observed minimum of the objective function and the optimized hyperparameter values.

bestOOBErr = results.MinObjective
bestHyperparameters = results.XAtMinObjective
bestOOBErr =

    1.1207


bestHyperparameters =

  1×2 table

    minLS    numPTS
    _____    ______

    7        6     

Train Model Using Optimized Hyperparameters

Train a random forest using the entire data set and the optimized hyperparameter values.

Mdl = TreeBagger(300,X,'MPG','Method','regression',...
    'MinLeafSize',bestHyperparameters.minLS,...
    'NumPredictorstoSample',bestHyperparameters.numPTS);

Mdl is TreeBagger object optimized for median prediction. You can predict the median fuel economy given predictor data by passing Mdl and the new data to quantilePredict.


Posted by uniqueone
,


'DistributionNames' = {'kernel', 'mn', 'mvmn', 'normal'}; % 
'Kernel' = {'normal', 'box', 'epanechnikov', 'triangle'};

'DistributionNames'을 'kernel'을 선택할 경우,  {'normal', 'box', 'epanechnikov', 'triangle'}중에서 하나 골라야하고, 나머지 'mn', 'mvmn', 'normal'중 하나일경우에는 'Kernel'은 설정하지 않는다.

Posted by uniqueone
,

https://github.com/fchollet/keras-resources


Keras resources

This is a directory of tutorials and open-source code repositories for working with Keras, the Python deep learning library.

If you have a high-quality tutorial or project to add, please open a PR.

Official starter resources

Tutorials

Code examples

Working with text

Working with images

Creative visual applications

Reinforcement learning

  • DQN
  • FlappyBird DQN
  • async-RL: Tensorflow + Keras + OpenAI Gym implementation of 1-step Q Learning from "Asynchronous Methods for Deep Reinforcement Learning"
  • keras-rl: A library for state-of-the-art reinforcement learning. Integrates with OpenAI Gym and implements DQN, double DQN, Continuous DQN, and DDPG.

Miscallenous architecture blueprints

Third-party libraries

  • Elephas: Distributed Deep Learning with Keras & Spark
  • Hyperas: Hyperparameter optimization
  • Hera: in-browser metrics dashboard for Keras models
  • Kerlym: reinforcement learning with Keras and OpenAI Gym
  • Qlearning4K: reinforcement learning add-on for Keras
  • seq2seq: Sequence to Sequence Learning with Keras
  • Seya: Keras extras
  • Keras Language Modeling: Language modeling tools for Keras
  • Recurrent Shop: Framework for building complex recurrent neural networks with Keras
  • Keras.js: Run trained Keras models in the browser, with GPU support
  • keras-vis: Neural network visualization toolkit for keras.

Projects built with Keras


Posted by uniqueone
,

http://jaejunyoo.blogspot.com/2017/03/nips-2016-tutorial-summary-nuts-and-bolts-of-building-AI-AndrewNg.html


2017년 3월 9일 목요일

[NIPS 2016 tutorial - Summary] Nuts and bolts of building AI applications using Deep Learning

Today, I am going to review a very educational tutorial by prof. Andrew Ng which was delivered in NIPS 2016. You can download the material by googling though it seems like that there is no official video clip provided from the NIPS 2016 homepage.

Still, you can see the video with almost identical contents (even the title is exactly the same) in the following YouTube link:


* I really recommend you guys to listen to his full lecture. Sometimes, however, watching video takes too much time to get a gist from it. Here, I tried to summarize what he have tried to deliver in his talk. I hope this helps.
** Note that I skipped a few slides or mixed their order to make it easier for me to explain.

TLDR;

  • Workflow guidelines

  • Follow this link and try some questionnaires. 


Outline

  • Trends of Deep Learning (DL)
    • Scale is driving DL progress
    • Rise of end-to-end learning
    • When to and when not to use "End-to-End" learning
  • Machine Learning (ML) Strategy (very practical advice)
    • How to manage train/dev/test data set and bias/variance
    • Basic recipe for ML
    • Defining a human level performance of each application is very useful

Trend #1


Q) Why is Deep Learning working so well NOW

A) Scale drives DL progress


The red line which stands for the traditional learning algorithms such as SVM and logistic regression shows a performance plateau after a while with a large amount of data. They did not know what to do with all the data we collected.

For last ten years, due to the rise of internet, mobile and IOT (internet of things), we could march along the X-axis. Andrew Ng commented that this is the number one reason why the DL algorithm works so well.

So... the implication of this :
To hit the top margin, you need a huge amount of data and a large NN model. 

Trend #2


The second major trend which he is excited about is end-to-end learning. 


Until recently, a lot of machine learning used real or integer numbers as output. In contrast to those, end-to-end learning can output much more complex things than numbers, e.g. image captioning.

It is called "end-to-end" learning because the input and output of the system are directly linked by a neural network unlike traditional models which have several intermediate steps:


This works well in many cases that are not effective when using traditional models. For example, end-to-end learning shows a better performance in speech recognition tasks.

While presenting this slide, he introduced the following anecdote:

"This end-to-end story really upset many people. I used to get around and say that I believe "phonemes" are the fantasy of the linguists and machines can do well without them. One day at the meeting in Stanford a linguist yelled at me in public for saying that. Well...we turned out to be right."

This story seems to say that end-to-end learning is a magic key for any application but rather he warned the audiences that they should be careful when applying the model to their problems.

Despite all the excitements about end-to-end learning, he does not think that this end-to-end learning is the solution for every application.  It works well in "some" cases but it does not in many others as well. For example, given the safety-critical requirement of autonomous driving and thus the need for extremely high levels of accuracy, a pure end-to-end approach is still challenging to get to work for autonomous driving.

In addition to this, he also commented that even though DL can almost always train a mapping from X to Y with a reasonable amount of data and you may publish a paper about it, it does not mean that using DL is actually a good idea, e.g. medical diagnosis or imaging.
End-to-End works only when you have enough (x,y) data to learn function of needed level of complexity. 
I totally agree with his point that we should not naively rely on the learning capability of the neural network. We should exploit all the power and knowledge of hand-designed or carefully chosen features which we already have.

In the same context, however, I have a slightly different point of view in "phonemes". I think that this can and should be also used as an additional feature in parallel which can reduce the labor of the neural network.

Machine Learning Strategy


Now let's move on to the next phase of his lecture. Here, he tries to give some sorts of answer or guideline to the following issues:
  • Often you will have a lot of ideas for how to improve an AI system, what do you do?
  • Good strategy will help avoid months of wasted effort. Then, what is it?

I think this part is a gist of his lecture. I really really liked his practical tips all of which can be actually applied in my situations right away.

One of those tips he proposed is a kind of "standard workflow" which guides you while training the model:


When the training error is high, this means that the bias between the output of your model and the real data is too big. To mitigate this issue, you need to train longer, use bigger model or adopt a new one. Next, you should check whether your dev error is high or not. If it is, you need more data, try to use some regularization, or use a new model architecture.

* Yes I know, this seems too obvious. Still, I want to mention that everything seems simple once it is organized under an unified system. Constructing an implicit know-how to an explicit framework is not an easy thing.

Here, you should be careful with the implication of the keywords, bias and variance. In his talk, bias and variance have slightly different meanings than textbook definitions (so we do not try to trade off between both entities) although they share a similar concept.

In the era before DL, people used to trade off between the bias and variance by playing with regularization and this coupling was not able to overcome because they were tied too strongly. 

Nowadays, however, the coupling between these two seems like to become weaker than before because you can deal with both separately by using simple strategies, i.e. use bigger model (bias) and gather more data (variance).

This also implicitly shows the reason why DL seems to be more applicable to various problems than the traditional learning models. By using DL, there are always at least two ways to solve the problems we are stuck in real life situations as introduced above.

Human Level Error as a Reference


To say whether your error is high or low, you need a reference. Andrew Ng suggests to use a human level error as an optimal error, or Bayes error . He strongly recommended to find the number before going deep in research because this is the very critical component to guide your next step.

Let's say our goal is to build a human level speech system using DL.  What we usually do with our data set is to split them with three sets; train, dev(val) and test. Then, the gaps between these errors may occur as below:


You can see the gaps between the errors are named as bias and variance. If you take time and think a while, you will find that it is quite intuitive why he named the gap between human level error and training set error as bias and the other as variance

If you find that your model has a high bias and a low variance, try to find a new model architecture or simply increase the capacity of the model. On the other hand, if you have a low bias but a high variance, you'd be better to try gathering more data as an easy remedy. 

As you can see, because you now use a human level performance as a baseline, you can always have a guideline where to focus on among several options you may have. 


Note that he did not say that it is "easy" to train a big model or to gather a huge amount of data. What he tries to deliver here is that at least you have an "easy option to try" even though you are not an expert in the area. You know... building a new model architecture which actually works is not a trivial task even for the experts. 

Still, there remains some unavoidable issues you need to overcome. 


Data Crisis


To deal with a finite amount of data to efficiently train the model, you need to carefully manipulate the data set or find a way to get more data (data synthesis). Here, I will focus on the former which brings more intuitions for practitioners.

Say you want to build a speech recognition system for a new in-car rearview mirror product. You have 50,000 hours of general speech data and 10 hours of in-car data. How do you split your data?

This is a BAD way to do it:


Having a mismatched dev and test distributions is not a good idea. You may spend months optimizing for dev set performance only to find it does not work well on the test set. 

So the following is his suggestion to do better:


A few remaining remarks

While the performance is worse than humans, there are many good ways to progress;
  • error analysis
  • estimate bias/variance
  • etc.
After surpassing the human performance or at least near the point, however, what you usually observe is that the progress becomes slow and almost stuck. There can be several reasons such as:
  • Label is made by human (so the limit lies here)
  • Maybe because human level error is close to the optimal error (Bayes error)
What you can do here is to find a subset of data that still works worse than human and make the model do better. 


I hope you enjoyed my summary. Thank you for reading :)

Interesting references

  • Slides (link)
  • Github markdown which you can actually try the workflow by clicking the multiple choices with questions. (link)
Posted by uniqueone
,
https://medium.com/towards-data-science/linear-algebra-cheat-sheet-for-deep-learning-cd67aba4526c#.2dqnqasml


Linear algebra cheat sheet for deep learning

While participating in Jeremy Howard’s excellent deep learning course I realized I was a little rusty on the prerequisites and my fuzziness was impacting my ability to understand concepts like backpropagation. I decided to put together a few wiki pages on these topics to improve my understanding. Here is a prettier version of my linear algebra page.

What is linear algebra?

In the context of deep learning, linear algebra is a mathematical toolbox that offers helpful techniques for manipulating groups of numbers simultaneously. It provides structures like vectors and matrices (spreadsheets) to hold these numbers and new rules for how to add, subtract, multiply, or divide them.

Why is it useful?

It turns complicated problems into simple, intuitive, and efficiently calculated problems. Here is an example of how linear algebra can achieve greater simplicity in code.

# Multiply two arrays 
x = [1,2,3]
y = [2,3,4]
product = []
for i in range(len(x)):
product.append(x[i]*y[i])
# Linear algebra version
x = numpy.array([1,2,3])
y = numpy.array([2,3,4])
x * y

How is it used in deep learning?

Neural networks store weights in matrices. Linear algebra makes matrix operations fast and easy, especially when training on GPUs. In fact, GPUs were created with vector and matrix operations in mind. Similar to how images can be represented as arrays of pixels, video games generate compelling gaming experiences using enormous, constantly evolving matrices. Instead of processing pixels one-by-one, GPUs manipulate entire matrices of pixels in parallel.

Vectors

Vectors are 1-dimensional arrays of numbers or terms. In geometry, vectors store the magnitude and direction of a potential change to a point in space. The vector [3, -2] for instance says go right 3 and down 2. A vector with more than one dimension is called a matrix.

Vector notation

There are a variety of ways to represent vectors. Here are a few you might come across in your reading.

Vectors in geometry

Vectors typically represent movement from a point. They store both the magnitude and direction of potential changes to a point. The vector [-2,5] says move left 2 units and up 5 units. Source.

v = [-2, 5]

A vector can be applied to any point in space. The vector’s direction equals the slope of the hypotenuse created moving up 5 and left 2. Its magnitude equals the length of the hypotenuse.

Scalar operations

Scalar operations involve a vector and a number. You modify the vector in-place by adding, subtracting, or multiplying the number from all the values in the vector.

Scalar addition

Elementwise operations

In elementwise operations like addition, subtraction, and division, values that correspond positionally are combined to produce a new vector. The 1st value in vector A is paired with the 1st value in vector B. The 2nd value is paired with the 2nd, and so on. This means the vectors must have equal dimensions to complete the operation.*

Vector addition
y = np.array([1,2,3])
x = np.array([2,3,4])
y + x = [3, 5, 7]
y - x = [-1, -1, -1]
y / x = [.5, .67, .75]

*In numpy if one of the vectors is of size 1 it can be treated like a scalar and applied to the elements in the larger vector. See below for more details on broadcasting in numpy.

Vector multiplication

There are two types of vector multiplication: Dot product and Hadamard product.

Dot product

The dot product of two vectors is a scalar. Dot product of vectors and matrices (matrix multiplication) is one of the most important operations in deep learning.

y = np.array([1,2,3])
x = np.array([2,3,4])
np.dot(y,x) = 20

Hadamard product

Hadamard Product is elementwise multiplication and it outputs a vector.

y = np.array([1,2,3])
x = np.array([2,3,4])
y * x = [2, 6, 12]

Vector fields

A vector field shows how far the point (x,y) would hypothetically move if we applied a vector function to it like addition or multiplication. Given a point in space, a vector field shows the power and direction of our proposed change at a variety of points in a graph.

Source

This vector field is an interesting one since it moves in different directions depending the starting point. The reason is that the vector behind this field stores terms like 2x or instead of scalar values like -2 and 5. For each point on the graph, we plug the x-coordinate into 2x or and draw an arrow from the starting point to the new location. Vector fields are extremely useful for visualizing machine learning techniques like Gradient Descent.

Matrices

A matrix is a rectangular grid of numbers or terms (like an Excel spreadsheet) with special rules for addition, subtraction, and multiplication.

Matrix dimensions

We describe the dimensions of a matrix in terms of rows by columns.

a = np.array([
[1,2,3],
[4,5,6]
])
a.shape == (2,3)
b = np.array([
[1,2,3]
])
b.shape == (1,3)

Matrix scalar operations

Scalar operations with matrices work the same way as they do for vectors. Simply apply the scalar to every element in the matrix — add, subtract, divide, multiply, etc.

Matrix scalar addition
a = np.array(
[[1,2],
[3,4]])
a + 1
[[2,3],
[4,5]]

Matrix elementwise operations

In order to add, subtract, or divide two matrices they must have equal dimensions.* We combine corresponding values in an elementwise fashion to produce a new matrix.

a = np.array([
[1,2],
[3,4]
])
b = np.array([
[1,2],
[3,4]
])
a + b
[[2, 4],
[6, 8]]
a — b
[[0, 0],
[0, 0]]

Numpy broadcasting*

I can’t escape talking about this, since it’s incredibly relevant in practice. In numpy the dimension requirements for elementwise operations are relaxed via a mechanism called broadcasting. Two matrices are compatible if the corresponding dimensions in each matrix (rows vs rows, columns vs columns) meet the following requirements:

  1. The dimensions are equal, or
  2. One dimension is of size 1
a = np.array([
[1],
[2]
])
b = np.array([
[3,4],
[5,6]
])
c = np.array([
[1,2]
])
# Same no. of rows
# Different no. of columns
# but a has one column so this works
a * b
[[ 3, 4],
[10, 12]]
# Same no. of columns
# Different no. of rows
# but c has one row so this works
b * c
[[ 3, 8],
[5, 12]]
# Different no. of columns
# Different no. of rows
# but both a and c meet the
# size 1 requirement rule
a + c
[[2, 3],
[3, 4]]

Things get weirder in higher dimensions — 3D, 4D, but for now we won’t worry about that. It’s less common in deep learning.

Matrix Hadamard product

Hadamard product of matrices is an elementwise operation, just like vectors. Values that correspond positionally are multiplied to product a new matrix.

a = np.array(
[[2,3],
[2,3]])
b = np.array(
[[3,4],
[5,6]])
# Uses python's multiply operator
a * b
[[ 6, 12],
[10, 18]]

In numpy you can take the Hadamard product of a matrix and vector as long as their dimensions meet the requirements of broadcasting.

Matrix transpose

Neural networks frequently process weights and inputs of different sizes where the dimensions do not meet the requirements of matrix multiplication. Matrix transpose provides a way to “rotate” one of the matrices so that the operation complies with multiplication requirements and can continue. There are two steps to transpose a matrix:

  1. Rotate the matrix right 90°
  2. Reverse the order of elements in each row (e.g. [a b c] becomes [c b a])

As an example, transpose matrix M into T:

a = np.array([
[1, 2],
[3, 4]])
a.T
[[1, 3],
[2, 4]]

Matrix multiplication

Matrix multiplication specifies a set of rules for multiplying matrices together to produce a new matrix.

Rules

Not all matrices are eligible for multiplication. In addition, there is a requirement on the dimensions of the resulting matrix output. Source.

  1. The number of columns of the 1st matrix must equal the number of rows of the 2nd
  2. The product of an M x N matrix and an N x K matrix is an M x K matrix. The new matrix takes the rows of the 1st and columns of the 2nd

Steps

Matrix multiplication relies on dot product to multiply various combinations of rows and columns. In the image below, taken from Khan Academy’s excellent linear algebra course, each entry in Matrix C is the dot product of a row in matrix A and a column in matrix B.

Source

The operation a1 · b1 means we take the dot product of the 1st row in matrix A (1, 7) and the 1st column in matrix B (3, 5).

Here’s another way to look at it:

Why does matrix multiplication work this way?

It’s useful. There is no mathematical law behind why it works this way. Mathematicians developed it because it streamlines previously tedious calculations. It’s an arbitrary human construct, but one that’s extremely useful.

Test yourself with these examples

Matrix multiplication with numpy

Numpy uses the function np.dot(A,B) for both vector and matrix multiplication. It has some other interesting features and gotchas so I encourage you to read the documentation here before use.

a = np.array([
[1, 2]
])
a.shape == (1,2)
b = np.array([
[3, 4],
[5, 6]
])
b.shape == (2,2)
# Multiply
mm = np.dot(a,b)
mm == [13, 16]
mm.shape == (1,2)

Tutorials

Khan Academy Linear Algebra
Deep Learning Book Math Section
Andrew Ng’s Course Notes
Explanation of Linear Algebra
Explanation of Matrices
Intro To Linear Algebra


Please hit the ♥ button below if you enjoyed reading. Also feel free to suggest new linear algebra concepts I should add to this post!

Posted by uniqueone
,

Android에서 TensorFlow 실행하기 – 꿈꾸는 개발자의 로그
http://www.kmshack.kr/2017/03/android%ec%97%90%ec%84%9c-tensorflow-%ec%8b%a4%ed%96%89%ed%95%98%ea%b8%b0/
Posted by uniqueone
,

[머신러닝] 19. 머신러닝 학습 방법(part 14) - AutoEncoder(6) : 네이버 블로그
http://blog.naver.com/laonple/220949087243
Posted by uniqueone
,

Neural networks and deep learning
http://neuralnetworksanddeeplearning.com/chap1.html

Hello guys,

If any of you are getting started with Deep Learning, I highly recommend this book. It's well written, nicely paced, clear, and starts right from the basic. In brief, it's perfect for a beginner to Deep Learning.

Hope this helps some learners!

Good luck!
Posted by uniqueone
,
http://alexandria.tue.nl/extra2/afstversl/tm/Visser_2016.pdf을 보고 fitglm을 다양한 파라미터로 해보기

http://d-scholarship.pitt.edu/8524/1/01ZhaoMYdissertation.pdf


https://esc.fnwi.uva.nl/thesis/centraal/files/f993098462.pdf


Numerical methods using matlab


Posted by uniqueone
,
Posted by uniqueone
,

http://geum.tistory.com/3


Multivariable analysis(다변수 분석) 중 의학 통계에서 많이 사용되는 것은 크게 3가지가 있다.

1) Multiple Linear regression
  : yi = α + β1xi1 + β2xi2 + β3xi3 + · · · · · · + βkxik + ε

2) Logistic regression
  : ln[p/1-p] =  α + β1xi1 + β2xi2 + β3xi3 + · · · · · · + βkxik

3) Proportional hazard regression
 : λi[t] = λ0[t] exp(α + β1xi1 + β2xi2 + β3xi3 + · · · · · · + βkxik )

 다변수 분석은 말 그대로 다양한 독립변수를 통계적 모형에 넣어서 서로의 영향을 보정(adjust)하고, 상호작용(interaction)을 계산하고 나아가서 더 정확하게 종속변수를 예측할 수 있다.

 세가지 통계적 모형은 전부 좌측항의 종속변수(yi, ln[p/1-p], λi[t]) 를 예측하기 위해
선형 모형(α + β1xi1 + β2xi2 + β3xi3 + · · · · · · + βkxik + ε)을 사용하는데 이런 선형 모형을
일반화하여 분석하는 것이 Generalized Linear Model이다.

여기서 일반화 한다는 것은 이런 선형모형을 가지고 위 세가지의 통계적 모형 뿐만 아니라
다야한 통계모형을 구축하여 분석할 수 있다는 것이다.

하지만 위 세가지 모형에서 선형 모형이 종속변수와 연결된 "함수 형태"가 각기 다르다.
예로 2)의 logistic regression 같은 경우 ln[p/1-p]의 형태로 연결 되어있는데 이렇게
독립변수와 선형모형의 종속변수를 연결하는 함수를 연결함수(link function)라고 한다.

또한 종속변수의 분포(distribution)도 정규분포,이항분포, 포아송 분포 등 다양한데
GLM에서는 다양한 분포와 연결함수를 가지고 다양한 통계적 모형을 구축하여 분석할 수 있다.


간단한 logsitic regression 을 GLM으로 분석해보자.

apache  fate
0         Alive
2         Alive
3         Alive
4         Alive
5         Alive
6         Alive
7         Alive
8         Alive
9         Alive
10       Alive
11       Alive
12       Alive
13       Alive
14       Alive
15       Alive
16       Alive
17       Dead
18       Dead
19       Alive
20       Alive
21       Dead
22       Dead
23       Alive
24       Dead
25       Dead
26       Dead
27       Alive
28       Dead
29       Dead
30       Dead
31       Dead
32       Dead
33       Dead
34       Dead
35       Dead
36       Dead
37       Dead
41       Alive

38명의 환자의자료로서 독립변수는 APACHE score, 종속변수는 사망 여부이다.
종속변수가 이항변수이므로 APACHE score가 얼마나 사망여부를 예측할 수 있느가를
분석하기 위해 간단히 logistic regression 을 시행하여 OR(p/1-p)를 구할 수 있으나
GLM으로도 가능하다.

(다음은 STATA에서 GLM을 시행시킨 명령어임)

glm fate apache, family(binomial) link(logit)

-> glm[GLM시행하라는 명령어] fate[종속변수 이름] apahce[독립변수 이름], family(binomial)[분포] link(logit) [연결함수]

실제로 시행시키면 선형모형의 회귀계수값을 구해지고 간단한 공식을 이용해 각 환자의
사망확률을 계산할 수 있다. 이를 그래프로 나타내면 다음과 같다.


점은 실제 간찰된 각 환자 케이스에서 APACHE score와 실제 사망여부를 표시하였고
곡선은 실행한 GLM모형으로 예측한 APACHE score에 대한 사망확률 여부를 보여 준다.
(SPSS에서 logistic regression을 실행했을 때 보여주는 집단 분류 히스토그램과는 약간
다름)


cf) 실제 proportional hazard regression의 경우 GLM을 잘 이용하지 않음.
실제 의학통계에서는 Log-linear model, Possion regression model 을 주로
GLM으로 시행함.


Posted by uniqueone
,

https://www.neuraldesigner.com/blog/5_algorithms_to_train_a_neural_network


5 algorithms to train a neural network

By Alberto Quesada, Artelnics.


algorithm picture

The procedure used to carry out the learning process in a neural network is called the training algorithm. There are many different training algorithms, whith different characteristics and performance.

Problem formulation

The learning problem in neural networks is formulated in terms of the minimization of a loss function, f. This function is in general, composed of an error and a regularization terms. The error term evaluates how a neural network fits the data set. On the other hand, the regularization term is used to prevent overfitting, by controlling the effective complexity of the neural network.

The loss function depends on the adaptative parameters (biases and synaptic weights) in the neural network. We can conveniently group them together into a single n-dimensional weight vector w. The picture below represents the loss function f(w).

Loss function picture


As we can see in the previous picture, the point w* is minima of the loss function. At any point A, we can calculate the first and second derivatives of the loss function. The first derivatives are gropued in the gradient vector, whose elements can be written

if(w) = df/dwi (i = 1,...,n)


Similarly, the second derivatives of the loss function can be grouped in the Hessian matrix,

Hi,jf(w) = d2f/dwi·dwj (i,j = 1,...,n)


The problem of minimizing continuous and differentiable functions of many variables has been widely studied. Many of the conventional approaches to this problem are directly applicable to that of training neural networks.

One-dimensional optimization

Although the loss function depends on many parameters, one-dimensional optimization methods are of great importance here. Indeed, they are are very often used in the training process of a neural network.

Indeed, many training algorithms first compute a training direction d and then a traning rate η that minimizes the loss in that direction, f(η). The next picture illustrates this one-dimensional function.

one-dimensional function picture


The points η1 and η2 define an interval that contains the minimum of f, η*.

In this regard, one-dimensional optimization methods search for the minimum of a given one-dimensional function. Some of the algorithms which are widely used are the golden section method and the Brent's method. Both reduce the bracket of a minumum until the distance between the two outer points in the bracket is less than a defined tolerance.

Multidimensional optimization

The learning problem for neural networks is formulated as searching of a parameter vector w* at which the loss function f takes a minimum value. The necessary condition states that if the neural network is at a minimum of the loss function, then the gradient is the zero vector.

The loss function is, in general, a non linear function of the parameters. As a consequence, it is not possible to find closed training algorithms for the minima. Instead, we consider a search through the parameter space consisting of a succession of steps. At each step, the loss will decrease by adjusting the neural network parameters.

In this way, to train a neural network we start with some parameter vector (often chosen at random). Then, we generate a sequence of parameters, so that the loss function is reduced at each iteration of the algorithm. The change of loss between two steps is called the loss decrement. The training algorithm stops when a specified condition, or stopping criterion, is satisfied.

Now, we are going to describe the most importat training algorithms for neural networks.

Algorithm types


1. Gradient descent

Gradient descent, also known as steepest descent, is the simplest training algorithm. It requires information from the gradient vector, and hence it is a first order method.

Let denote f(wi) = fi and ᐁf(wi) = gi. The method begins at a point w0 and, until a stopping criterion is satisfied, moves from wi to wi+1 in the training direction di = -gi. Therefore, the gradient descent method iterates in the following way:

wi+1 = wi - di·ηi,   i=0,1,...


The parameter η is the training rate. This value can either set to a fixed value or found by one-dimensional optimization along the training direction at each step. An optimal value for the training rate obtained by line minimization at each successive step is generally preferable. However, there are still many software tools that only use a fixed value for the training rate.

The next picture is an activity diagram of the training process with gradient descent. As we can see, the parameter vector is improved in two steps: First, the gradient descent training direction is computed. Second, a suitable training rate is found.

Gradient descent diagram


The gradient descent training algorithm has the severe drawback of requiring many iterations for functions which have long, narrow valley structures. Indeed, the downhill gradient is the direction in which the loss function decreases most rapidly, but this does not necessarily produce the fastest convergence. The following picture illustrates this issue.

Gradient descent picture


Gradient descent is the recommended algorithm when we have very big neural networks, with many thousand parameters. The reason is that this method only stores the gradient vector (size n), and it does not store the Hessian matrix (size n2).

2. Newton's method

The Newton's method is a second order algorithm because it makes use of the Hessian matrix. The objective of this method is to find better training directions by using the second derivatives of the loss function.

Let denote f(wi) = fi, ᐁf(wi) = gi and Hf(wi) = Hi. Consider the quadratic approximation of f at w0 using the Taylor's series expansion

f = f0 + g0 · (w - w0) + 0.5 · (w - w0)2 · H0


H0 is the Hessian matrix of f evaluated at the point w0. By setting g equal to 0 for the minimum of f(w), we obtain the next equation

g = g0 + H0 · (w - w0) = 0


Therefore, starting from a parameter vector w0, Newton's method iterates as follows

wi+1 = wi - Hi-1·gi,   i=0,1,...


The vector Hi-1·gi is known as the Newton's step. Note that this change for the parameters may move towards a maximum rather than a minimum. This occurs if the Hessian matrix is not positive definite. Thus, the function evaluation is not guaranteed to be reduced at each iteration. In order to prevent such troubles, the Newton's method equation usually modified as:

wi+1 = wi - (Hi-1·gi)·ηi,   i=0,1,...


The training rate, η, can either set to a fixed value or found by line minimization. The vector d = Hi-1·gi is now called the Newton's training direction.

The state diagram for the training process with the Newton's method is depicted in the next figure. Here improvement of the parameters is performed by obtaining first the Newton's training direction and then a suitable training rate.

Newton's method diagram


The picture below illustrates the performance of this method. As we can see, the Newton's method requires less steps than gradient descent to find the minimum value of the loss function.

Newton's method graph


However, the Newton's method has the difficulty that the exact evaluation of the Hessian and its inverse are quite expensive in computational terms.


3. Conjugate gradient

The conjugate gradient method can be regarded as something intermediate between gradient descent and Newton's method. It is motivated by the desire to accelerate the typically slow convergence associated with gradient descent. This method also avoids the information requirements associated with the evaluation, storage, and inversion of the Hessian matrix, as required by the Newton's method.

In the conjugate gradient training algorithm, the search is performed along conjugate directions which produces generally faster convergence than gradient descent directions. These training directions are conjugated with respect to the Hessian matrix.

Let denote d the training direction vector. Then, starting with an initial parameter vector w0 and an initial training direction vector d0 = -g0, the conjugate gradient method constructs a sequence of training directions as:

di+1 = gi+1 + di·γi,   i=0,1,...


Here γ is called the conjugate parameter, and there are different ways to calculate it. Two of the most used are due to Fletcher and Reeves and to Polak and Ribiere. For all conjugate gradient algorithms, the training direction is periodically reset to the negative of the gradient.

The parameters are then improved according to the next expression. The training rate, η, is usually found by line minimization.

wi+1 = wi + di·ηi,   i=0,1,...


The picture below depicts an activity diagram for the training process with the conjugate gradient. Here improvement of the parameters is done by first computing the conjugate gradient training direction and then suitable training rate in that direction.

Conjugate gradient diagram


This method has proved to be more effective than gradient descent in training neural networks. Since it does not require the Hessian matrix, conjugate gradient is also recommended when we have very big neural networks.


4. Quasi-Newton method

Application of the Newton's method is computationally expensive, since it requires many operations to evaluate the Hessian matrix and compute its inverse. Alternative approaches, known as quasi-Newton or variable metrix methods, are developed to solve that drawback. These methods, instead of calculating the Hessian directly and then evaluating its inverse, build up an approximation to the inverse Hessian at each iteration of the algorithm. This approximation is computed using only information on the first derivatives of the loss function.

The Hessian matrix is composed of the second partial derivatives of the loss function. The main idea behind the quasi-Newton method is to approximate the inverse Hessian by another matrix G, using only the first partial derivatives of the loss function. Then, the quasi-Newton formula can be expressed as:

wi+1 = wi - (Gi·gi)·ηi,   i=0,1,...


The training rate η can either set to a fixed value or found by line minimization. The inverse Hessian approximation G has different flavours. Two of the most used are the Davidon–Fletcher–Powell formula (DFP) and the Broyden–Fletcher–Goldfarb–Shanno formula (BFGS).

The activity diagram of the quasi-Newton training process is illustrated bellow. Improvement of the parameters is performed by first obtaining the quasi-Newton training direction and then finding a satisfactory training rate.

Quasi newton algorithm diagram


This is the default method to use in most cases: It is faster than gradient descent and conjugate gradient, and the exact Hessian does not need to be computed and inverted.


5. Levenberg-Marquardt algorithm

The Levenberg-Marquardt algorithm, also known as the damped least-squares method, has been designed to work specifically with loss functions which take the form of a sum of squared errors. It works without computing the exact Hessian matrix. Instead, it works with the gradient vector and the Jacobian matrix.

Consider a loss function which can be expressed as a sum of squared errors of the form

f = ∑ ei2,   i=0,...,m


Here m is the number of instances in the data set.


We can define the Jacobian matrix of the loss function as that containing the derivatives of the errors with respect to the parameters,

Ji,jf(w) = dei/dwj (i = 1,...,m & j = 1,...,n)


Where m is the number of instances in the data set and n is the number of parameters in the neural network. Note that the size of the Jacobian matrix is m·n.


The gradient vector of the loss function can be computed as:

ᐁf = 2 JT·e


Here e is the vector of all error terms.


Finally, we can approximate the Hessian matrix with the following expression.

Hf ≈ 2 JT·J + λI


Where λ is a damping factor that ensures the positiveness of the Hessian and I is the identity matrix.


The next expression defines the parameters improvement process with the Levenberg-Marquardt algorithm

wi+1 = wi - (JiT·JiiI)-1·(2 JiT·ei),   i=0,1,...


When the damping parameter λ is zero, this is just Newton's method, using the approximate Hessian matrix. On the other hand, when λ is large, this becomes gradient descent with a small training rate.

The parameter λ is initialized to be large so that first updates are small steps in the gradient descent direction. If any iteration happens to result in a failure, then λ is increased by some factor. Otherwise, as the loss decreases, λ is decreased, so that the Levenberg-Marquardt algorithm approaches the Newton method. This process typically accelerates the convergence to the minimum.

The picture below represents a state diagram for the training process of a neural network with the Levenberg-Marquardt algorithm. The first step is to calculate the loss, the gradient and the Hessian approximation. Then the damping parameter is adjusted so as to reduce the loss at each iteration.

Levenberg-Marquardt algorithm diagram


As we have seen the Levenberg-Marquardt algorithm is a method tailored for functions of the type sum-of-squared-error. That makes it to be very fast when training neural networks measured on that kind of errors. However, this algorithm has some drawbacks. The first one is that it cannnot be applied to functions such as the root mean squared error or the cross entropy error. Also, it is not compatible with regularization terms. Finally, for very big data sets and neural networks, the Jacobian matrix becomes huge, and therefore it requires a lot of memory. Therefore, the Levenberg-Marquardt algorithm is not recommended when we have big data sets and/or neural networks.


Memory and speed comparison

The next graph depicts the computational speed and the memory requirements of the training algorithms discussed in this post. As we can see, the slowest training algorithm is usually gradient descent, but it is the one requiring less memory. On the contrary, the fastest one might be the Levenberg-Marquardt algorithm, but usually requires a lot of memory. A good compromise might be the quasi-Newton method.

Performance comparison between algorithms


To conclude, if our neural networks has many thousands of parameters we can use gradient descent or conjugate gradient, in order to save memory. If we have many neural networks to train with just a few thousands of instances and a few hundreds of parameters, the best choice might be the Levenberg-Marquardt algorithm. In the rest of situations, the quasi-Newton method will work well.


Posted by uniqueone
,
An Interactive Tutorial on Numerical Optimization
http://www.benfrederickson.com/numerical-optimization/
Posted by uniqueone
,

matlab feval VS predict

Matlab 2017. 3. 7. 20:24
https://www.mathworks.com/help/stats/generalizedlinearmodel.feval.html

feval allows you to easily evaluate predictions of a model when the model was fitted using a table or dataset array. predict requires a table or dataset array with the same predictor names, but you can use simple arrays of scalars with feval.

Posted by uniqueone
,
http://stackoverflow.com/questions/29014170/matlabs-glmfit-vs-fitglm

I'm trying to perform logistic regression to do classification using MATLAB. There seem to be two different methods in MATLAB's statistics toolbox to build a generalized linear model 'glmfit' and 'fitglm'. I can't figure out what the difference is between the two. Is one preferable over the other?

Here are the links for the function descriptions.

http://uk.mathworks.com/help/stats/glmfit.html http://uk.mathworks.com/help/stats/fitglm.html


4down voteaccepted

The difference is what the functions output. glmfit just outputs a vector of the regression coefficients (and some other stuff if you ask for it). fitglm outputs a regression object that packs all sorts of information and functionality inside (See the docs on GeneralizedLinearModel class). I would assume the fitglm is intended to replace glmfit.


Posted by uniqueone
,
http://stackoverflow.com/questions/22915003/is-there-any-function-to-calculate-precision-and-recall-using-matlab


Is there any function to calculate Precision and Recall using Matlab?

I have problem about calculating the precision and recall for classifier in matlab. I use fisherIris data (that consists of 150 datapoints, 50-setosa, 50-versicolor, 50-virginica). I have classified using kNN algorithm. Here is my confusion matrix:

50     0     0
 0    48     2
 0     4    46

correct classification rate is 96% (144/150), but how to calculate precision and recall using matlab, is there any function? I know the formulas for that precision=tp/(tp+fp),and recall=tp/(tp+fn), but I am lost in identifying components. For instance, can I say that true positive is 144 from the matrix? what about false positive and false negative? Please help!!! I would really appreciate! Thank you!

share|improve this question
    
sorry sorry ,we are talking different one – dato datuashvili Apr 7 '14 at 14:21
    
How do you get to 144? – Dan Apr 7 '14 at 14:24
    
I have got this number by summing up the diagonal of confusion matrix, 50+48+46, considering as correctly classified data – user19565 Apr 7 '14 at 14:28
    
you have 3 classes? Are you sure precision and recall generalize to classification with more than 2 classes? – Dan Apr 7 '14 at 14:36
1  

2 Answers 2

To add to pederpansen's answer, here are some anonymous Matlab functions for calculating precision, recall and F1-score for each class, and the mean F1 score over all classes:

precision = @(confusionMat) diag(confusionMat)./sum(confusionMat,2);

recall = @(confusionMat) diag(confusionMat)./sum(confusionMat,1)';

f1Scores = @(confusionMat) 2*(precision(confusionMat).*recall(confusionMat))./(precision(confusionMat)+recall(confusionMat))

meanF1 = @(confusionMat) mean(f1Scores(confusionMat))
share|improve this answer
    
Thank you very much!!! – user19565 Mar 17 '16 at 11:47

As Dan pointed out in his comment, precision and recall are usually defined for binary classification problems only.

But you can calculate precision and recall separately for each class. Let's annotate your confusion matrix a little bit:

          |                  true           |
          |      |  seto  |  vers  |  virg  |
          -----------------------------------
          | seto |   50        0        0
predicted | vers |    0       48        2
          | virg |    0        4       46

Here I assumed the usual convention holds, i.e. columns are used for true values and rows for values predicted by your learning algorithm. (If your matrix was built the other way round, simply take the transpose of the confusion matrix.)

The true positives (tp(i)) for each class (=row/column index) i is given by the diagonal element in that row/column. The true negatives (tn) then are given by the sum of the remaining diagonal elements. Note that we simply define the negatives for each class i as "not class i".

If we define false positives (fp) and false negatives (fn) analogously as the sum of off-diagonal entries in a given row or column, respectively, we can calculate precision and recall for each class:

precision(seto) = tp(seto) / (tp(seto) + fp(seto)) = 50 / (50 + (0 + 0)) = 1.0
precision(vers) = 48 / (48 + (0 + 2)) = 0.96
precision(virg) = 46 / (46 + (0 + 4)) = 0.92

recall(seto) = tp(seto) / (tp(seto) + fn(seto)) = 50 / (50 + (0 + 0)) = 1.0
recall(vers) = 48 / (48 + (0 + 4)) = 0.9231
recall(virg) = 46 / (46 + (0 + 2)) = 0.9583

Here I used the class names instead of the row indices for illustration.

Please have a look at the answers to this question for further information on performance measures in the case of multi-class classification problems - particularly if you want to end up with single number instead of one number for each class. Of course, the easiest way to do this is just averaging the values for each class.

Update

I realized that you were actually looking for a Matlab function to do this. I don't think there is any built-in function, and on the Matlab File Exchange I only found a function for binary classification problems. However, the task is so easy you can easily define your own functions like so:

function y = precision(M)
  y = diag(M) ./ sum(M,2);
end

function y = recall(M)
  y = diag(M) ./ sum(M,1)';
end

This will return a column vector containing the precision and recall values for each class, respectively. Now you can simply call

>> mean(precision(M))

ans =

    0.9600

>> mean(recall(M))

ans =

    0.9605

to obtain the average precision and recall values of your model.


Posted by uniqueone
,
http://people.cs.uchicago.edu/~dinoj/matlab/


Some Matlab Code

This collection of Matlab code is brought to you by the phrases "caveat emptor" and "quid quid latine dictum sit, altum videtur", and by the number 404.

Wrapper Code for LIBSVM

batchtest.m : Runs batches of train+test tasks using LIBSVM (Chang & Lin 2000), including model selection for the RBF kernel. Uses svmlwrite.m (by Anton Schwaighofer) and getcm.m. If you ask for class probability estimates, you will also need readprobest.m.

nfolds.m : Combines makefolds.m and batchtest.m

readprobest.m : Reads class probability estimates output when you use the "-b" option with LIBSVM.

splitbysomething.m : Like batchtest, but allows you to create different classifiers for different partitions of all the data. It requires the function ispartition.m.

General Machine Learning

makefolds.m : creates indices of train and test sets for each of n folds for deterministic cross-validation.

makesplits.m : partitions a vector by its values. makefolds could be made shorter if it made calls to makesplits, but I'm not going to change that (now).

getcm.m : Gets confusion matrices, accuracy, precision, recall, F-score, from actual and predicted labels.

precrec.m : Produces precision-recall and ROC curves given true labels and real-valued classifier output. Only for binary classifiers. Uses getcm.

choosebestscore.m : Chooses highest score (given precomputed scores) of elements in sequences.

revhmm.m : Does Viterbi decoding given posteriors.

Manifold Stuff

KADRE.zip : Kick-ass dimensionality reduction (versions of Laplacian Eigenmaps and Isomap that use the Cover Tree algorithm to create the nearest neighbor graph... covertree code only works on linux)

Speech Stuff

makepitchtier.m : creates PitchTier file (for Praat) given measurement times and values.

Visualization / Partiview

Ndaona : package for producing partiview files for interactive 3d or 3d+time models

partiviewangles.m Calculates coordinates Rx and Ry required by Partiview to position a camera. (Very useful.... but use tfm.pl instead.)

Sequence Data

For a description of the SEQ (and FLAT) formats that I use to store data for sequential classification, see my Sequential Data / Classification page.

seqread.m : reads from a file with SEQ data to a SEQ Matlab structure.

seqread.m : writes to a file with SEQ data from a SEQ Matlab structure.

seq2flat : converts from a SEQ Matlab structure to a FLAT Matlab structure.

seqkeepcols.m : converts from a SEQ Matlab structure to another SEQ Matlab structure but with only selected columns.

Tone Recognition

For a description of the PWS (Phrase-Word-Syllable) format that I use to store data for tone recognition, see my Tone Recognition page.

pws2textgrid.m : creates Praat-formatted TextGrid files, with three tiers for Phrase, Word, and Syllable, of a PWS structure (or a cell array thereof).

textgrid2pws.m : reads Praat-formatted TextGrid files into a PWS structure. Good for replacing automatic alignments with manually corrected alignments. (Remember to press SHIFT while doing the manual alignment so that boundaries across different tiers remain aligned!)

'Matlab > Source Code' 카테고리의 다른 글

Top 10 most popular MATLAB & Simulink file downloads from last year  (0) 2017.03.18
random forest using matlab  (0) 2017.03.12
plot standard deviation and mean  (0) 2017.02.08
matlab dist function  (0) 2017.01.17
matlab de2bi source code  (0) 2017.01.17
Posted by uniqueone
,

http://shb.skku.edu/bigs/menu3/sub01.jsp


빅 데이터(기계학습/패턴분석)의 수학적 이해를 위한 책들


- 성균관대 수학과 교수 정윤모


  1. 데이터 과학 (data science)

    데이터 과학에 필요한 수학

    데이터 과학 학습을 위한 책 목록


데이터 과학 (data science)


  이 분야를 폭넓게 가리키는 말은 빅 데이터(Big data), 인공지능(Artificial intelligence)이라 할 수 있고, 수학적인 부분을 추린다면 기계학습(machine learning) 또는 패턴 분석(pattern recognition/classification)으로 관심을 좁힐 수 있다. 빅 데이터의 중요성이 점점 더 증가함에 따라 데이터 과학(Data science)라고도 불리며 아래의 데이터 과학 벤 다이어그램(data science venn diagram)에서 볼 수 있듯이 수학은 데이터 과학의 핵심 요소이다.


  여기서 Hacking Skills이란 컴퓨터 프로그래밍 능력, 특히 수치계산 코딩 능력, 알고리즘 사고 능력이라고 볼 수 있고, substantive expertise는 데이터가 어떻게 얻어졌으며 어떤 내용과 정보를 가지고 있는지, 데이터 자체에 대한 지식을 말한다. 다른 말로는 domain knowledge라고도 할 수 있다. 자세한 내용은 다음 Drew Conway의 홈페이지에서 보기 바란다.

http://drewconway.com/zia/2013/3/26/the-data-science-venn-diagram


데이터 과학에 필요한 수학


  빅 데이터 또는 데이터 과학의 필수 수학은 확률/통계(Probability/Statistcs), 수치선형대수(Numerical Linear Algebra), 최적화(Optimization)로 요약할 수 있다. 데이터 과학 벤다이어그램에서 hacking skill은 프로그래밍 능력이라고 줄여 말할 수 있는데, R 또는 Python, 혹은 두 언어를 다 사용할 수 있는 기본적인 프로그래밍 능력을 갖추면 된다.


수학 지식이 필요한 순서를 도식적으로 나열한다면 아래의 도표로 표현할 수 있다.


데이터 과학 학습을 위한 책 목록


  이 글은 빅 데이터 분야의 지식을 갖추기 위해서 볼 만한 책들을 골랐으며, 가급적 무료로 인터넷을 통해서 받을 수 있는 책들을 골랐다. 수학과 학부 3, 4 학년 또는 대학원을 진학하는 학생의 수학 실력을 가정하고 책을 선정했다. 무엇을 배우려고 하면, 최소한의 기본 지식이 있어야 한다.


  책의 첫 장부터 마지막 장까지 읽는 것은 절대로 추천하지 않는다. 소설 읽기가 아니다. 시간 낭비다. 자신에게 필요한 것이 뭐고 무엇을 읽어야 하는지 파악하라. 필요했을 때 배우고 사용한 지식이 제대로 배운 지식이고 오래간다. 가장 중요한 것은 ‘무엇을 알고 있는가’가 아니라 ‘무엇을 할 수 있는가’다.


  책을 고를 때 너무 두꺼운 책들은 좋지 않다. 특히 원서는 영어가 능숙하다 하더라도 독해능력과 속도가 영어권 사람들에게 비해 현저하게 떨어질 수밖에 없다. 따라서 말로 풀어서 길게 설명한 책보다는 핵심만 간략하게 설명하고 수식과 그림, 표로 잘 설명된 책을 선택하는 것이 좋은 방법이다. 백과사전식으로 포괄적으로 정리된 책보다는 강의 교재에 가깝게 간략하게 핵심만 수록돼 있는 책을 선택하는 게 좋다. 어쩔 수 없이 장황한 책을 볼 때는 자신에게 필요하고 중요한 부분을 선택적으로 잘 추려서 읽는 힘이 필요하다. 모르는 것이 생길 때마다 필요한 부분만 찾아서 보는 것도 빨리 잘 배울 수 있는 방법이다.


  유투브(utube)에 올라온 짧은 강의, 인터넷에서 받을 수 있는 강의 노트, 강의 슬라이드가 빠른 시간에 핵심 내용을 파악하거나 꼭 필요한 부분이 무엇인지 아는데 좋다. 대규모온라인무료강의(MOOC)를 이용하는 것도 좋은 방법이다.


  경험과 호불호가 영향을 주었겠지만, 인터넷의 여러 정보를 참조했으며 널리 쓰이는 책들을 위주로 선정하였다. 인터넷에서도 비슷한 내용의 목록을 찾을 수 있을 것이며 목록에 많은 유사성이 있음을 확인할 수 있을 것이다. 중요함에도 부주의, 실수, 무지로 인해 빠진 책들의 추천을 언제든지 환영하며 인터넷 링크가 잘못됐거나 정보가 바뀐 것이 있으면 알려주면 고맙겠다.


  다음 링크의 책 목록들도 유용하다.


UC Berkeley 통계학과의 대학원생들이 만든 통계학 추천 책 목록이다.

https://www.stat.berkeley.edu/mediawiki/index.php/Recommended_Books#Theoretical_Statistics

또 다음은 데이터 과학 분야의 무료 책들을 잘 모아 놨다. 이 글에서 추천하는 책들의 링크도 있을 것이다.

https://www.analyticsvidhya.com/blog/2016/02/free-read-books-statistics-mathematics-data-science/


  수학 지식이 어느 정도 된다면 바로 시작해도 그만이다. 공부하다가 수학이 부족하다고 느끼면 부족한 부분을 매우고 다시 공부해도 좋다. 패턴분석이던 수학이던 필요한 부분이 생기면 그때그때 적절히 공부하라. 최근 이 분야가 가장 뜨거운 감자이므로 인터넷에 좋은 강의 교재, 책, 또는 대규모온라인무료강의(MOOC)같은 온라인 강좌가 많이 있으니 이를 이용하는 것도 좋은 방법이다.


Pattern Recognition and Machine Learning, by Christopher Bishop, Springer

- 대표적인 교재이지만 조금 두껍고 장황하다. 영어가 능숙하다면 말로 잘 풀어서 설명했으므로 초보자가 이해하기 좋지만 그렇지 않다면 읽는데 시간이 걸린다.


The Elements of Statistical Learning, by Trevor Hastie, Robert Tibshirani, and Jerome Friedman, Springer

http://statweb.stanford.edu/~tibs/ElemStatLearn/

- 대학원 수준의 표준 교재이다. 이 분야의 바이블같은 책이지만 초심자에게는 어려울 수 있다.


An Introduction to Statistical Learning: with Applications in R, by Gareth James, Daniela Witten, Trevor Hastie and Robert Tibshirani, Springer

http://www-bcf.usc.edu/~gareth/ISL/

- 위 책의 저자가 쓴 학부 수준의 교재로 R을 같이 공부할 수 있다.


Pattern Classification, by Richard O. Duda, Peter E. Hart, and David G. Stork, Wiley-Interscience

- 과거 이 분야에서 바이블처럼 보던 교재이다. 번역도 돼있고, Bishop 책보다는 읽기 쉬울 수 있다.


Data Mining And Analysis, by Mohammed J. Zaki, and Wagner Meira Jr, Cambridge University Press

http://www.dataminingbook.info/pmwiki.php/Main/BookDownload

- 이 분야는 책으로 출판했지만 온라인에 공개되어 있는 경우가 많은데 이런 책들을 이용하는 것도 좋은 방법이다. 개인적인 온라인 사용을 전제로 다운로드 받을 수 있다.


Deep Learning, by Ian Goodfellow, Yoshua Bengio, Aaron Courville, MIT Press

https://github.com/HFTrader/DeepLearningBook

- 많은 기계학습의 문제들에서 가장 좋은 결과를 내고 있으며 최근 Alphago 등을 통하여 일반인들도 알려진 심화학습(deep learning)의 학습서이다. 2016년 연말에 출간될 예정이다.


Understanding Machine Learning: From Theory to Algorithms, by Shai Shalev-Shwartz, Shai Ben-David, Cambridge University Press

http://www.cs.huji.ac.il/~shais/UnderstandingMachineLearning/

- 기본 내용을 이해하고 좀 더 수학적인 입장에서 접근할 때 좋은 책이다.


A Probabilistic Theory of Pattern Recognition, by Luc Devroye, Laszlo Gyorfi, and Gabor Lugosi, Springer

- 패턴 분석의 본격적인 수학 이론 도서라고 할 수 있다.


  기계학습/패턴 분석 교재들의 앞부분에 정리되어 있는 확률/통계 부분도 도움이 된다. 기계학습/패턴 분석에 필요한 확률/통계가 잘 정리되어 있고 특히 이해를 돕는 좋은 그림들이 많다. 예를 들면 패턴 분석/기계학습에서 추천한 다음 책이 그러하다.


Data Mining And Analysis, by Mohammed J. Zaki, and Wagner Meira Jr, Cambridge University Press

http://www.dataminingbook.info/pmwiki.php/Main/BookDownload

www.cs.rpi.edu/~zaki/dataminingbook


All of Statistics: A Concise Course in Statistical Inference, by Larry Wasserman, Springer

- 기계학습, 데이터 과학 분야의 응용을 고려한 기초 통계 교재이다.


Theoretical Statistics, by Robert W. Keener, Springer

- 대학원 수준의 기본 통계 교재이다.


확률은 측도론(measure theory)이 나오지 않는 기초 책들은 소개하지 않겠다. 인터넷에서 구할 수 있는 학교/강의 교재, 비디오 교재, 자료들을 참고하라. 우연(random)과 확률변수(random variable)의 의미를 깨닫는 것이 중요하다. 그리고 대수정리(Law of large number), 중심극한정리(central limit theorem)와 같은 기본 이론의 의미를 깨닫는 것이 필요하다.


Probability with Martingales, by David Williams, Cambridge University Press

- 우연과 확률변수의 의미를 깨달았고 좀 더 수학적으로 접근하고 싶다면 측도론을 바탕으로 한 책들을 공부해야 한다. 간략하게 요점이 잘 정리돼 있다.


Probability: Theory and Examples, by Rick Durrett, Cambridge University Press

https://services.math.duke.edu/~rtd/PTE/pte.html

- 측도론 기반의 대학원 수준의 표준 교재이다. 여러 학교에서 교재로 사용한다.


기본 확률/통계를 이해했다면 확률보행(random walk), 마르코프 연쇄 등의 (Markov chain)확률과정론(Stochastic process)의 기본 내용을 알아두는 것이 좋다.


Markov Chains, by Norris, Cambridge University Press

- 마르코프 연쇄의 좋은 입문서이다.


Introduction to Stochastic Processes, by Gregory F. Lawler, Chapman and Hall

- 기본적인 확률과정론 교재이다.


Markov Chain and Mixing Times, by Levin, Peres and Wilmer, American Mathematical Society

http://pages.uoregon.edu/dlevin/MARKOV/
- 기본적인 확률과정론 교재이며 인터넷에서 다운받을 수 있다.


  정형 데이터는 행렬로 표현된다. 따라서 행렬의 성질을 이해하고 계산할 수 있는 능력은 데이터 처리의 기본이다. 또한 모든 과학계산은 결국 수치선형대수의 문제로 귀결된다고 해도 틀린 말은 아니다.


Numerical Linear Algebra, by Lloyd N. Trefethen, and David Bau III, SIAM

- 수치선형대수의 표준 교재이다.


Applied Numerical Linear Algebra, by James W. Demmel, SIAM

- 표준 교재이며 모델링과 응용 측면이 잘 소개돼 있다.


Iterative Methods for Sparse Linear Systems, by Yousef Saad, SIAM

http://www-users.cs.umn.edu/~saad/IterMethBook_2ndEd.pdf

- 거대 희소 행렬(large sparse)을 풀기 위한 반복법(iterative method)에 대한 기본 교재이다. 희소성과 반복법은 빅 데이터를 처리하는 기본 아이디어들이다.


Matrix Computations, by Gene H. Golub, and Charles F. Van Loan, Johns Hopkins University Press

- 행렬 계산의 방법들을 집대성해놓은 고전이다.


Matrix Analysis, by Roger A. Horn, and Charles R. Johnson, Cambridge University Press

- 행렬 이론을 본격적으로 공부할 수 있는 이론 도서이다. 국내에 수입되어 있다.


  패턴 분석, 기계학습에서는 많은 경우 확률이 가장 높은 예를 답으로 찾기 때문에 최적화 문제가 근본적으로 나온다.


Convex Optimization, by Stephen Boyd, Lieven Vandenberghe, Cambridge University Press

http://stanford.edu/~boyd/cvxbook/

- 기본 교재로 인터넷에서 다운로드 받을 수 있다. 공대 대학원 교재이기도 함으로 깊은 수학적 배경 없이 읽을 수 있다. 이론적 배경이 나오는 5장, 알고리즘이 나오는 9, 10, 11장만 읽으면 충분하다.


Nonlinear Programming, by Dimitri P. Bertsekas, Athena Scientific

- 대학원 수준의 교재이다. 좀 더 최적화를 깊게 공부할 수 있는 책이다.


Numerical Optimization, by Jorge Nocedal, Stephen Wright, Springer

- 대학원 수준의 교재이다.


Convex Analysis, by Ralph Tyrell Rockafellar, Princeton University Press

- 볼록 해석(convex analysis)의 이론이 필요하거나 모르는 부분이 생기면 참조해야 하는 책이다. 볼록 해석(convex analysis)의 고전이다. 교과서로 사용하기에는 굉장히 형식적이며 읽기 딱딱하다. 참고서로 생각하라.


  벡터 미적분학은 삼각함수나 미분적분학처럼 기본으로 알고 있어야하기 때문에 위에서 언급하지 않았다. 하지만 문제는, 특히 수학과 출신들이 이 과목을 잘 모르고 있다는 점이다.

행렬을 다룬다는 것은 다차원의 선형 분석과 깊이 관련돼 있다. 따라서 다차원 벡터의 이해와 분석에 대한 기본 지식은 필수적이다. 또한 다차원의 기울기(gradient), 발산(divergence), 회전(curl)과 같은 기본개념들은 확률보행, 확산과정(diffusion process)와 같은 확률과정론적 접근과 데이터의 기하학을 이해하기 위한 필수 요소들이다.


Vector Calculus, by Jerrold E. Marsden, and Anthony Tromba, W. H. Freeman

- 학부 2-3학년 수준의 표준 교재이다. 판이 올라가면서 점점 두꺼워지고 장황해 지는 경향이 있다.


Advanced Engineering Mathematics, by Erwin Kreyszig, Wiley

- 이 책의 벡터 미적분학 부분만 보는 것도 좋은 방법이다. 물리적 의미와 함께 잘 설명돼있다.


기존의 컴퓨터공학과 교육과정 때문에 C/C++나 Java를 알고 사용해야 한다고 생각하는 사람들이 많은데 이것은 대단한 오해다. 하드웨어에 최적화시켜 줄 수 있는 언어가 아니라 추상적인 작업을 할 수 있고 관련 패키지, 라이브러리가 많이 있어서 개발자 시간을 줄이는 것이 중요하다. 저급언어(low-level programming language)에 가까운 언어보다는 고급 언어(high-level programming language), 하드웨어에 최적화하기 쉬운 언어보다는 인간이 쓰기 편한 언어를 사용하라는 말이다. 자신의 아이디어를 구현하고 옳은지 확인하는 게 우선이다. 빠르게 실행되는 코드는 그 다음이다. 정말 빠른 코드가 필요하면 코딩 전문가에게 맡겨 버리면 그만이다. 다른 글 ‘컴퓨터 언어 빨리 배우기’도 참조하기 바란다.


다음은 어떤 언어들이 데이터 분야에 사용되는지에 관한 2014년 통계 자료이다.

http://www.kdnuggets.com/2014/08/four-main-languages-analytics-data-mining-data-science.html


입문을 위한 언어로는 R 또는 Python, 혹은 두 언어 다 아는 것으로 충분하며, 이 두 언어가 최종으로 필요한 언어가 될 가능성도 높다. 좀 더 하드웨어에 관련해서 들어가고자 하면 데이터베이스 관리를 위한 SQL, 클러스터에서 분산 처리를 위한 Hadoop 정도를 들 수 있을 것이다. R과 Python의 장단점과 비교를 알고 싶다면 아래의 링크를 참조하기 바란다.

http://dataconomy.com/r-vs-python-the-data-science-wars/

http://www.kdnuggets.com/2015/05/r-vs-python-data-science.html


R에 대한 참고 서적은 올리지 않겠다. R은 통계에 특화된 언어로 어쩌면 프로그래밍 언어라기보다는 패키지에 가까워서 몇 시간 안에 기본적인 사용법을 습득할 수 있다. R 홈페이지 의 매뉴얼 페이지에서

https://cran.r-project.org/manuals.html

‘An Introduction to R’ 정도 빠르게 읽고 사용해 보면 충분할 것이다.

패턴분석/기계학습에서 소개한 An Introduction to Statistical Learning: with Applications in R을 공부하면서 같이 배우는 것도 한 방법이다.


amazon.com에서 python을 검색하면 Mark Lutz이 쓴 Learning Python이 첫 번째로 나오는데, 1600 페이지에 달한다. 우리말도 아닌 영어로 된 1600 페이지 짜리 책을 컴퓨터 언어를 배우기 위해서 읽는다는 건 미친 짓이다. 한글로 된 몇백 페이지나 되는 책들도 마찬 가지다. 특히 베스트셀러라는 것에 속지 마라. 베스트셀러는 대부분 컴맹들을 위한 책이다. python은 쉽게 배울 수 있는 언어다.


컴퓨터 언어도 언어다. 외국어를 습득하기 위해서는 읽고 외우는게 아니라 계속해서 말하고 써야 늘듯이, 컴퓨터 언어도 계속해서 프로그래밍을 해봐야 는다. 따라서 정말로 문법을 모른다면 깔끔하게 짧게 정리된 강의교재나 tutorial을 인터넷에서 찾아서 보고 구현해 보라. 다음은 python의 문서 페이지이다. 본인 수준에 맞는 적절한 내용을 찾아보라.

https://www.python.org/doc/


tutorial도 참조하라.

https://docs.python.org/3/tutorial/index.html

https://docs.python.org/3/download.html

개발자인 Guido Van Rossum이 만들었는데, 언어를 개발한 철학이 느껴지지만 쉽지는 않다.


범용 언어로 python을 배우기보다는 과학계산, 데이터 처리용으로 배워야 한다는 것을 명심하라. 그런 의미에서는 다음의 과학계산 강의 노트를 추천한다.


Python Scientific lecture notes-EuroScipy tutorial team

www.scipy-lectures.org/_downloads/PythonScientific-simple.pdf


데이터 해석관련으로는 다음의 책을 추천한다. 번역본도 있다.


Python for Data Analysis: Data Wrangling with Pandas, NumPy, and IPython, by Wes McKinney, O'Reilly Media


  데이터 과학의 응용을 생각한다면 무인자동차처럼 신호, 이미지, 비디오, 영상 등에 관련된 다양한 기술들이 필요하다. 또한 소셜 네트워크를 분석하려면 그래프 이론이 필요하고, 좀 더 정확한 계산을 하고자 한다면 과학계산의 이론이 필요하다. 중요해 보이는 책 몇 권을 선정했다.


Digital Image Processing, by Rafael C. Gonzalez, and Richard E. Woods, Pearson

- 영상처리 기본 교과서이다. 기계학습 또는 인공지능의 기본 목표 중 하나가 인간 시각의 이해와 모방이다. 국내에 수입되어 있다.


Computer Vision: Algorithms and Applications, by Richard Szeliski, Springer

http://szeliski.org/Book

- 컴퓨터 비전에 대한 기본 교과서. Image Processing이 전자공학의 접근이라면 컴퓨터 비전은 컴퓨터 공학의 접근 방식이다.


A Wavelet Tour of Signal Processing, Stephane Mallat, Academic Press

- Wavelet과 신호 처리(signal processing)에 관한 명저이다. 영상 처리, 기계학습, 희소성 이론 등 다양한 내용을 포괄한다.


Spectral graph theory, by Fan R. K. Chung, American Mathematical Society

- 그래프 스펙트럼 이해에 기본 교과서이다. 처음 4장은 아래의 링크에서 받을 수 있다.

http://www.math.ucsd.edu/~fan/research/revised.html


Introduction to Algorithms, by Thomas H. Cormen, Charles E. Leiserson, Ronald L. Rivest, and Clifford Stein, MIT Press

- 알고리즘에 관한 기본 교과서이다. C/C++ 또는 Java가 어쩌고저쩌고 떠들지 말고 알고리즘 사고력이나 늘릴 것. 번역본이 있다.


Scientific computing, Michael T. Heath, McGraw-Hill

- 과학계산/수치해석의 기본 교과서이다. 학부 4학년 혹은 대학원 신입생 수준의 책이다.


Numerical Analysis by Richard L. Burden, J. Douglas Faires, and Annette M. Burden, Cengage Learning

- 학부 수준 과학계산/수치해석의 교과서이다.


Elementary Differential Geometry, by A.N. Pressley, Springer

- 기본적인 미분기하학 교재이다. 데이터를 잘 다루기 위해서는 다차원 공간의 기하학을 이해할 줄 알아야 한다. 특히 데이터의 비선형성이 강조될 때는 더욱 그러하다. 


Posted by uniqueone
,
https://sites.google.com/a/yoonkn.com/wiki/%EC%9D%B4%EA%B2%83%EC%A0%80%EA%B2%83/%EB%B0%B0%EC%B9%98%ED%8C%8C%EC%9D%BC%EC%97%90%EC%84%9C-%EB%82%A0%EC%A7%9C-%EC%8B%9C%EA%B0%84-%EB%94%B0%EC%98%A4%EA%B8%B0배치파일에서 날짜 시간 따오기
와 이거 아주 쉽게되네.
그냥 echo %date% %time% 해보자. date 와 time 이란 환경변수에 날짜 시간이 들어가 있다는것을 알았다면 게임끝. 적당히 보기좋은 이름으로 만들려면

echo %date:-=%-%time::=%

를 쳐보고 응용해보자. 마지막에 초가 소숫점단위로 나오는게 싫다면 다시 잘라내자.

set datetime=%date:-=%-%time::=%
set datetime=%datetime:~0,-3%
echo %datetime%


Posted by uniqueone
,
Here are 13 books on Machine Learning and Data Mining that are great resources, references, and refreshers for Data Scientists. (This is definitely a small selective subsample of the many excellent books available.)
The Top Ten Algorithms in Data Mining, by Xindong Wu and Vipin Kumar (editors)
Learning from Data, by Y.Abu-Mostafa, M.Magdon-Ismail, H-S.Lin
Mining of Massive Datasets, by Jeffrey David Ullman and Anand Rajaraman
Handbook of Statistical Analysis and Data Mining Applications, by G.Miner, J.Elder, R.Nisbet
Machine Learning for Hackers, by Drew Conway and John Myles White
Mahout in Action, by S.Owen, R.Anil, T.Dunning, E.Friedman
Statistical and Machine-Learning Data Mining: Techniques for Better..., by Bruce Ratner
Networks, Crowds, and Markets: Reasoning About a Highly Connected W..., by David Easley and Jon Kleinberg
Bayesian Reasoning and Machine Learning, by David Barber
Ensemble Methods in Data Mining: Improving Accuracy Through Combini..., by Giovanni Seni and John Elder (Older Edition is also available)
Data Mining with R: Learning with Case Studies, by Luis Torgo
Using R for Data Management, Statistical Analysis, and Graphics, by Nicholas Horton and Ken Kleinman
Introduction to Data Mining, by P-N.Tan, M.Steinbach, V.Kumar
And for my astronomer friends, here are a couple of additional suggestions:
 14.  Statistics, Data Mining, and Machine Learning in Astronomy: A Pract..., by Z.Ivezic, A.Connolly, J.VanderPlas, A.Gray
 15.  Advances in Machine Learning and Data Mining for Astronomy, by M.Way, J.Scargle, K.Ali, A.Srivastava
Posted by uniqueone
,

matlab에서 fitcsvm함수로 SVM분류기를 이용해 ROC curve를 그리려면, 학습한 SVM 모델을 fitPosterior함수(score 를 posterior probability로 변환)를 통해 모델을 변환한 후 predict함수의 입력모델로 써야 해줘야 test셋의 posterior probability를 구할 수 있다. 이 posterior probability를 perfcurve에 입력시켜 roc curve와 auc를 그릴 수 있다. 아래는 그 예제.


test_fitcsvm_predict_perfcurve1.m


close all; clear; clc;

% Load the ionosphere data set. Suppose that the last 10 observations become available after training the SVM classifier.
load ionosphere

n = size(X,1);       % Training sample size
% isInds = 1:(n-10);   % In-sample indices
% oosInds = (n-9):n;   % Out-of-sample indices
cp = cvpartition(Y, 'k', 5);
disp(cp)
trIdx = cp.training(1);
teIdx = cp.test(1);
isInds = find(trIdx);
oosInds = find(teIdx);


% Train an SVM classifier. It is good practice to standardize the predictors and specify the order of the classes.
% Conserve memory by reducing the size of the trained SVM classifier.
SVMModel = fitcsvm(X(isInds,:),Y(isInds),'Standardize',true, 'ClassNames',{'b','g'});
CompactSVMModel = compact(SVMModel);
whos('SVMModel','CompactSVMModel')

% The positive class is 'g'. The CompactClassificationSVM classifier (CompactSVMModel) uses less space than
% the ClassificationSVM classifier (SVMModel) because the latter stores the data.

% Estimate the optimal score-to-posterior-probability-transformation function.
fCompactSVMModel = fitPosterior(CompactSVMModel, X(isInds,:),Y(isInds))

% The optimal score transformation function (CompactSVMModel.ScoreTransform) is the sigmoid function
% because the classes are inseparable.
% Predict the out-of-sample labels and positive class posterior probabilities.
% Since true labels are available, compare them with the predicted labels.

[labels,PostProbs] = predict(fCompactSVMModel,X(oosInds,:));
table(Y(oosInds),labels,PostProbs(:,2),'VariableNames', {'TrueLabels','PredictedLabels','PosClassPosterior'})

a1 = Y(oosInds);
a2 = PostProbs(:,2);
a3 = Y{1};
[falsePositiveTree, truePositiveTree, T, AucTreeg] = perfcurve(Y(oosInds),PostProbs(:,2), Y{1});
plot(falsePositiveTree, truePositiveTree, 'LineWidth', 5)
xlabel('False positive rate');
ylabel('True positive rate');
title('ROC');

% a1 = Y(oosInds);
% a2 = PostProbs(:,2);
% a3 = Y{2};
% figure,
% [falsePositiveTree, truePositiveTree, T, AucTreeb] = perfcurve(Y(oosInds),PostProbs(:,2), Y{2});
% plot(falsePositiveTree, truePositiveTree, 'LineWidth', 5)
% xlabel('False positive rate');
% ylabel('True positive rate');
% title('ROC');

[~,scoresSVMModel] = predict(SVMModel,X(oosInds,:));
[~,scoresCompactSVMModel] = predict(CompactSVMModel,X(oosInds,:));
[~,scoresfCompactSVMModel] = predict(fCompactSVMModel,X(oosInds,:));
[falsePositiveTree, truePositiveTree, T, AucTreeg] = perfcurve(Y(oosInds),scores(:,2), Y{1});
plot(falsePositiveTree, truePositiveTree, 'LineWidth', 5)
xlabel('False positive rate');
ylabel('True positive rate');
title('ROC');


a1 = 1;


Posted by uniqueone
,

https://github.com/conda/conda/issues/1979


The response to this issue is

conda config --set ssl_verify false
conda update requests
conda config --set ssl_verify true
Posted by uniqueone
,